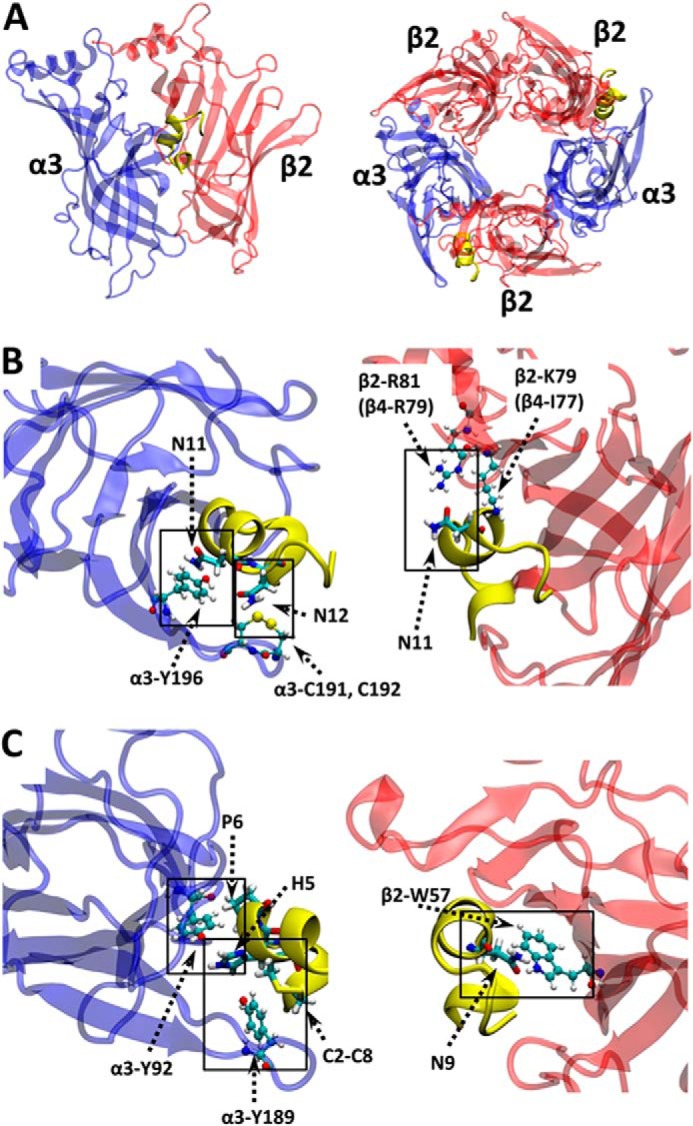
FIGURE 6.

Homology model and MD simulation of RegIIA bound to α3β2. A, illustration of the initial structure (homology model) of RegIIA toxin bound to the presumed inter-subunit C-loop pockets are shown in yellow. B, MD simulation snapshot (at 20 ns) of RegIIA bound with α3β2 showing interactions between Asn11, Asn12 and receptor residues at the α3(+) and β2(−) faces; C, and of pairwise interactions that are substantially reduced at α3β2 compared with α3β4 after the [N11A,N12A] mutation. Conotoxin side chains of interest are in licorice form. Receptor side chains are shown as ball and stick. Atoms are color coded as: C = cyan, H = white, N = blue, O = red, and S = yellow.
