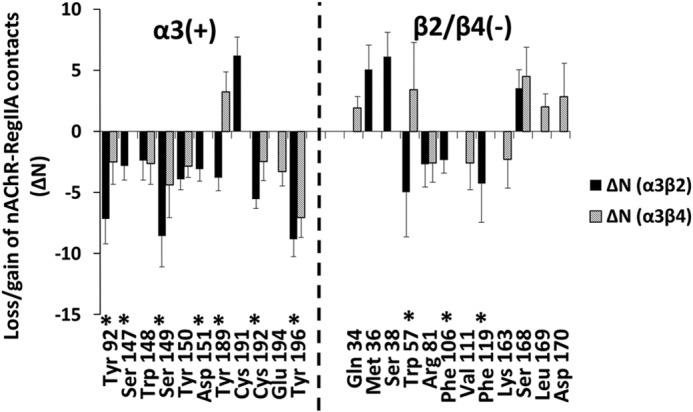
FIGURE 7.

Change in number of toxin atoms (ΔN) that lie within 4.5 Å of receptor residues (x axis) due to [N11A,N12A] double mutation of RegIIA. Asterisks indicate residues with substantially fewer contacts for α3β2 compared with α3β4. Residues from the β2 subunit are shown on the x axis. Data from α3β4 is at the homologous positions. Error bars are mean ± S.E. calculated over α(+)/β(−) interfaces for 10 independent simulations (20 data points in total).
