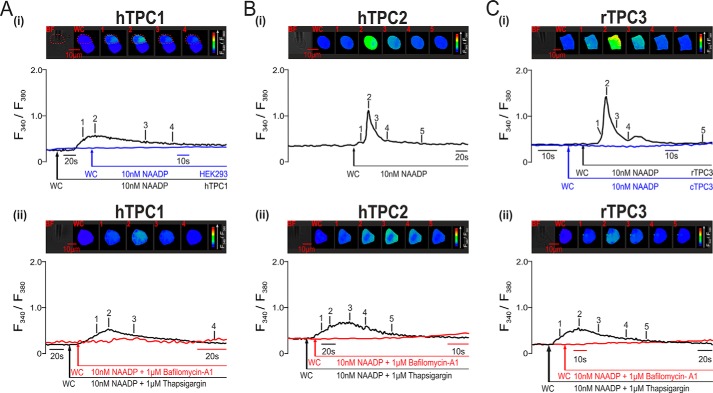
FIGURE 4.
NAADP-dependent Ca2+ signals via TPC2 and TPC3 (but not TPC1) couple to ER Ca2+ release in HEK293 cells. In A (panel i), the upper panel shows a bright-field image of a HEK293 cell that stably overexpressed hTPC1 and a series of pseudo-color images of the Fura-2 fluorescence ratio (F340/F380) recorded in the same cell (indicated by dashed red lines) during intracellular dialysis from a patch pipette of 10 nm NAADP. The lower panel shows the corresponding record of the F340/F380 ratio against time upon intracellular dialysis of 10 nm NAADP (black trace). The blue trace is a record of the F340/F380 ratio against time recorded in a wild-type HEK293 cell that was dialyzed with 10 nm NAADP. WC indicates the point at which intracellular dialysis commenced on entering the whole-cell configuration. In panel i in B and C, the conditions were similar to those described for panel i in A, but the HEK293 cells stably expressed hTPC2 (B), rTPC3 (C, images and black trace), or cTPC3 (C, blue trace), and 10 nm NAADP was introduced by pipette dialysis. In panel ii in A–C, the conditions were similar to those described for panel i in A–C, but the cells were preincubated with thapsigargin (1 μm; images and black traces) or bafilomycin A1 (1 μm; red traces) to deplete Ca2+ from ER or acidic stores, respectively.

