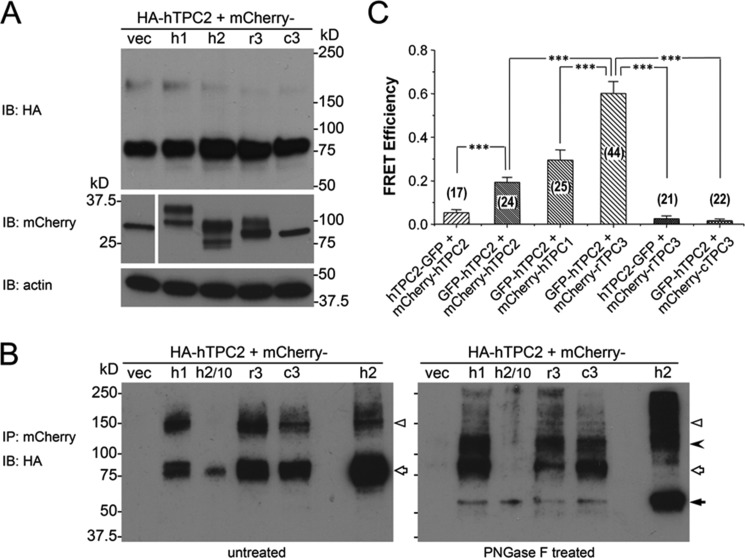
FIGURE 8.
Interaction between hTPC2 and other TPC isoforms when coexpressed in HEK293 cells. A, expression levels detected by immunoblotting (IB) of HA-hTPC2 (upper panel), mCherry (middle left panel), and mCherry-tagged TPC isoforms (middle right panel) in stable HA-hTPC2 cells transiently transfected with the cDNA for mCherry (vec) and N-terminal mCherry-tagged hTPC1 (h1), hTPC2 (h2), rTPC3 (r3), or cTPC3 (c3). Actin was used as a loading control (lower panel). B, co-IP of HA-hTPC2 by the anti-mCherry antibody. The immunoprecipitants were left untreated (left panel) or treated with PNGase F (right panel). Samples from mCherry-hTPC2-transfected cells (h2) were loaded as 1/10 (h2/10) and equivalent (h2) amounts compared with the other samples for immunoblotting. Open triangles indicate possible dimers. The filled arrowhead indicates reduced size of possible dimers after deglycosylation by PNGase F. Open arrows indicate the ∼85-kDa band mostly unaffected by PNGase F except for the mCherry-hTPC2-transfected cell samples. The filled arrow indicates the reduced size from the ∼85-kDa band. C, FRET efficiency between GFP and mCherry in HEK293 cells that coexpressed GFP-tagged hTPC2 (either N- or C-terminal tag) and N-terminal mCherry-tagged TPC isoforms as indicated. Data are means ± S.E. for the number of cells indicated in parentheses. ***, p < 0.001 determined by two-sample t test between the indicated groups.

