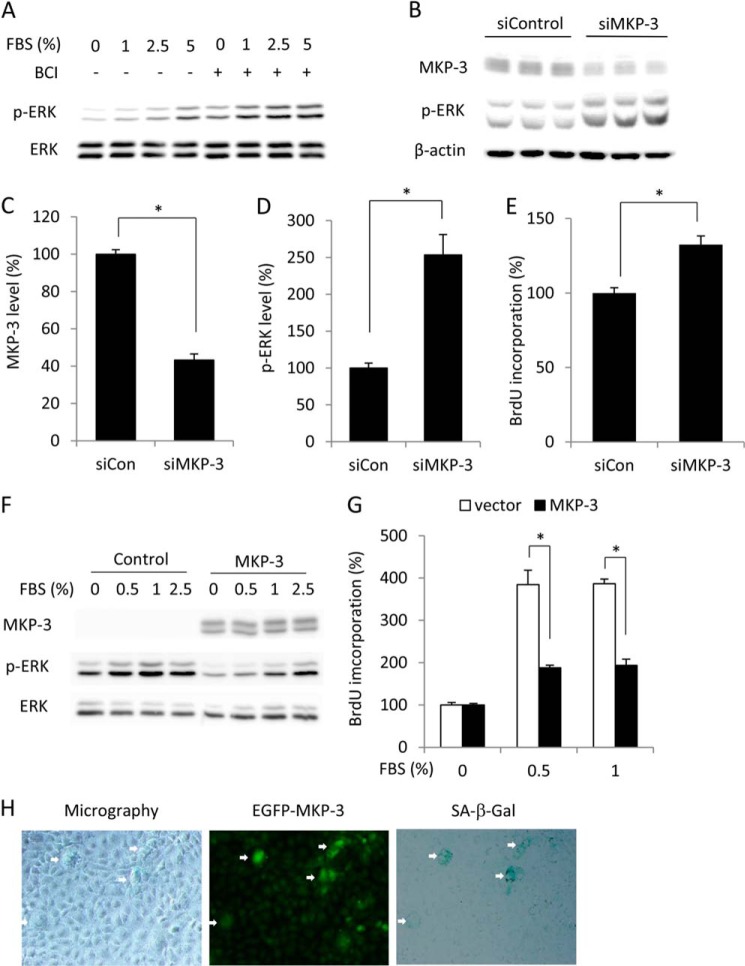
FIGURE 3.
Effect of MKP-3 on ERK1/2 phosphorylation, cell proliferation, cell size, and SA-β-gal activity. A–E, down-regulation of MKP-3 on ERK1/2 phosphorylation and cell proliferation. A, cells were pretreated with 1 μg/ml ETO for 3 days. After that, they were treated with 1 μm 2-benzylidene-3-(cyclohexylamino)-1-indanone hydrochloride (BCI) for 15 min or left untreated before being exposed to the indicated concentrations of FBS for an additional 5 min. Cell lysates were subjected to Western blot analysis of p-ERK1/2 and ERK1/2. B–E, cells were transfected with control or MKP-3 siRNA. Cell lysates were subjected to Western blot analysis of MKP-3 and p-ERK1/2. β-Actin was used as a loading control (B). Densitometric quantitations of the levels of MKP-3 and p-ERK1/2 in B are shown in C and D. The result was normalized to siRNA control (siCon). Data are mean ± S.E. (n = 3). *, p < 0.05 versus control. E, cells transfected with control or MKP-3 siRNA were subjected to BrdU incorporation. Data are mean ± S.E. (n = 4). *, p < 0.05 versus siRNA control. F and G, overexpression of MKP3 on ERK1/2 and cell proliferation. Cells that were transiently transfected with a control or MKP-3 plasmid were exposed to the indicated concentration of FBS for 5 min. Cellular protein was extracted and subjected to Western blot analysis of MKP-3, p-ERK, and ERK. G, cells transfected with control or MKP-3 plasmid were subjected to BrdU incorporation. Data are mean ± S.E.; n = 4; *, p < 0.05. H, transfection of NRK cells with a GFP-tagged MKP-3 gene on cell morphology and SA-β-gal activity. Cells were transfected with a GFP-tagged MKP-3 gene. After 4 days, cells were subjected to phase-contrast/immunofluorescence microscopy and SA-β-gal staining. Note the cell size and SA-β-gal activity in the GFP-positive cells (arrows).

