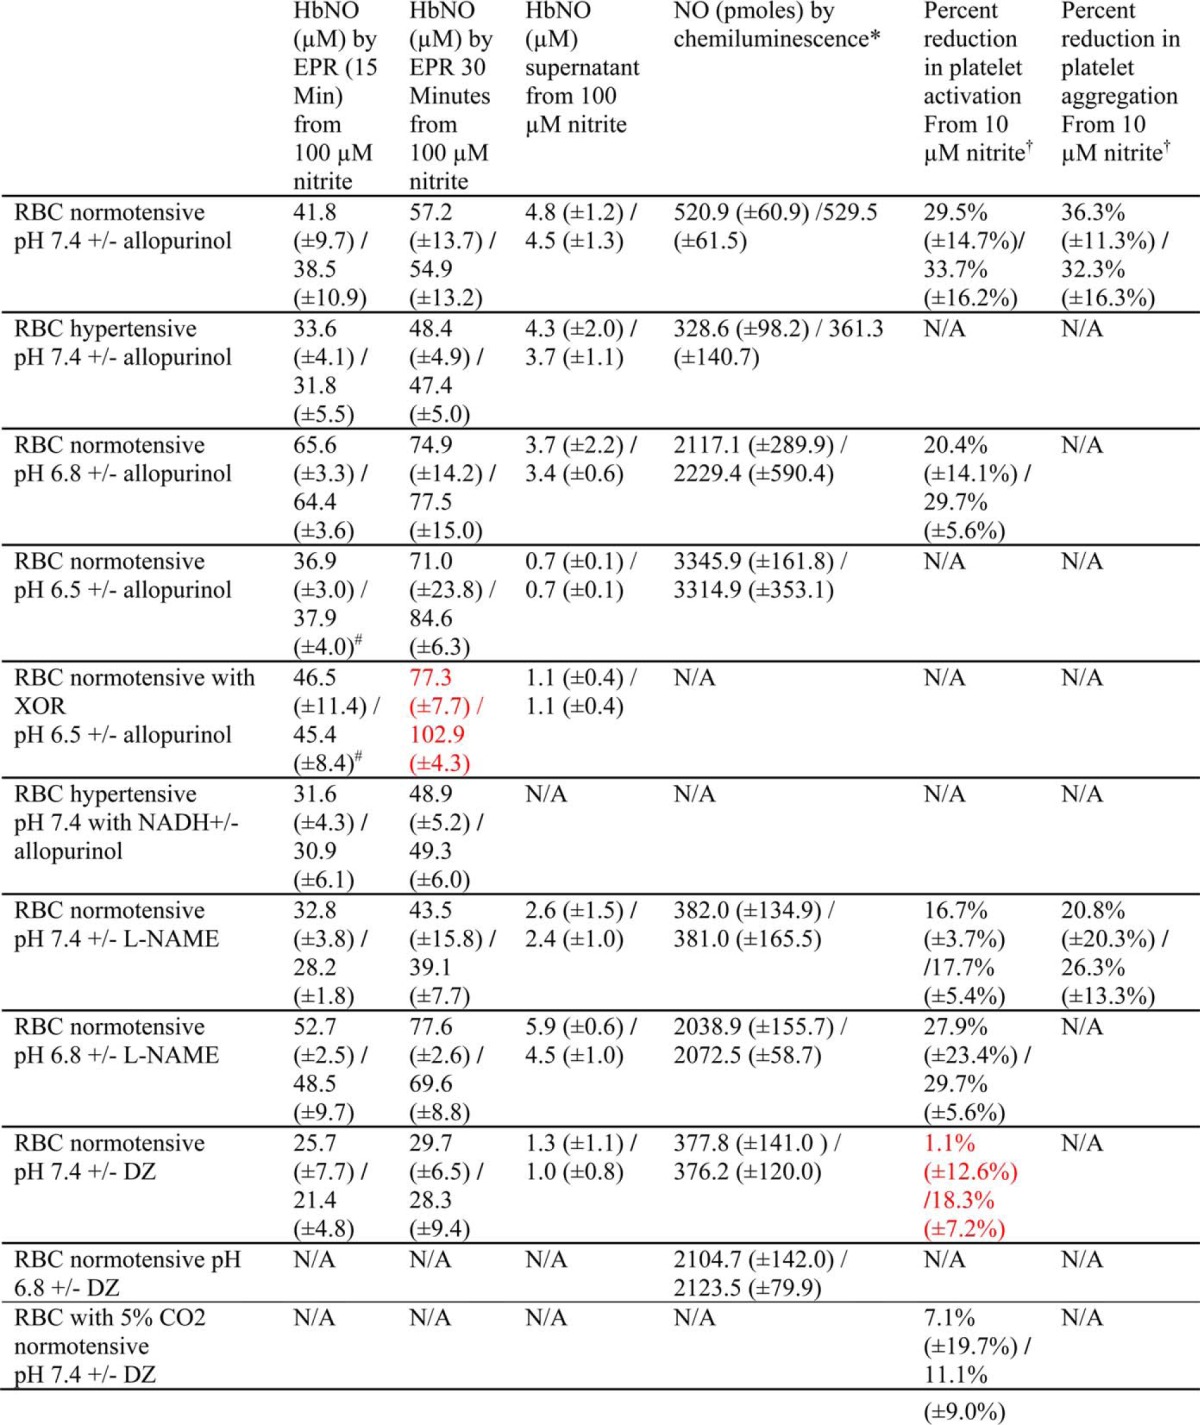
TABLE 1.
Nitrite bioactivation by RBCs

* The amount of NO detected by chemiluminescence is calculated based on a standard curve.
† Percent reduction is calculated by ((+RBCs+intrite)−(RBCs))/RBCs.
# EPR samples were prepared at 5 min.
The red color indicates significance. p < 0.05 comparing + vs. − inhibitor.
N/A; not available.
