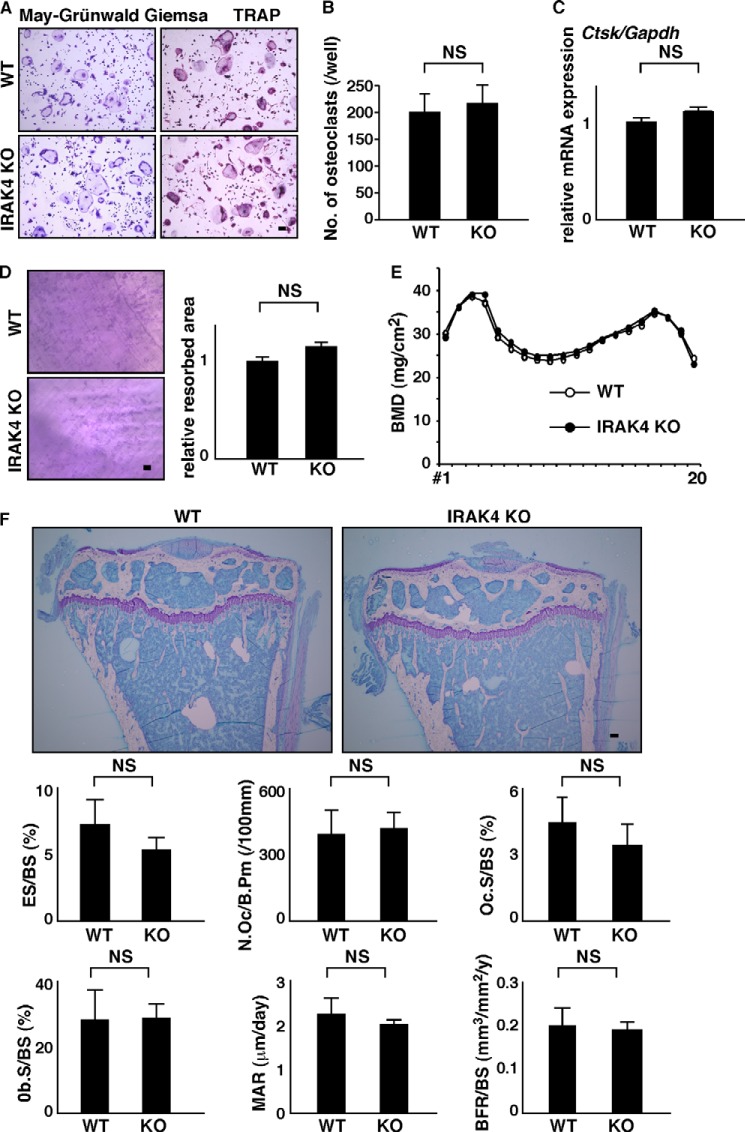
FIGURE 4.
Normal osteoclastogenesis and bone mass in IRAK4-deficient mice. A–C, osteoclast and FBGC common progenitor cells were isolated from wild-type or IRAK4-deficient mice and cultured in the presence of M-CSF plus RANKL for 4 days. Cells were then stained with TRAP (bar, 100 μm) (A), scored for the number of multinuclear osteoclasts containing more than three nuclei (NS, not significant; n = 3) (B), and analyzed for Ctsk expression relative to Gapdh by quantitative real time PCR (C). Resorption pits appearing on dentine slices were visualized by toluidine blue staining (D, left panel), and the relative resorbed area was quantified (NS, not significant; n = 3) (D, right panel) (bar, 200 μm). Representative data from at least three independent experiments are shown. E, BMD of femurs divided equally longitudinally from wild-type and IRAK4-deficient mice. Representative data of two independent experiments are shown (n = 5). F, representative toluidine blue O staining images and bone morphometric analysis of 8-week-old female wild-type or IRAK4-deficient mice. Shown are toluidine blue O staining, eroded surface per bone surface (ES/BS), the number of osteoclasts per bone perimeter (N.Oc/B.Pm), osteoclast surface per bone surface (OcS/BS), osteoblast surface per bone surface (ObS/BS), mineral apposition rate (MAR), and bone formation rate per bone surface (BFR/BS). Data are quantified as means ± S.D. NS, not significant, n = 4 (WT) and 5 (KO).

