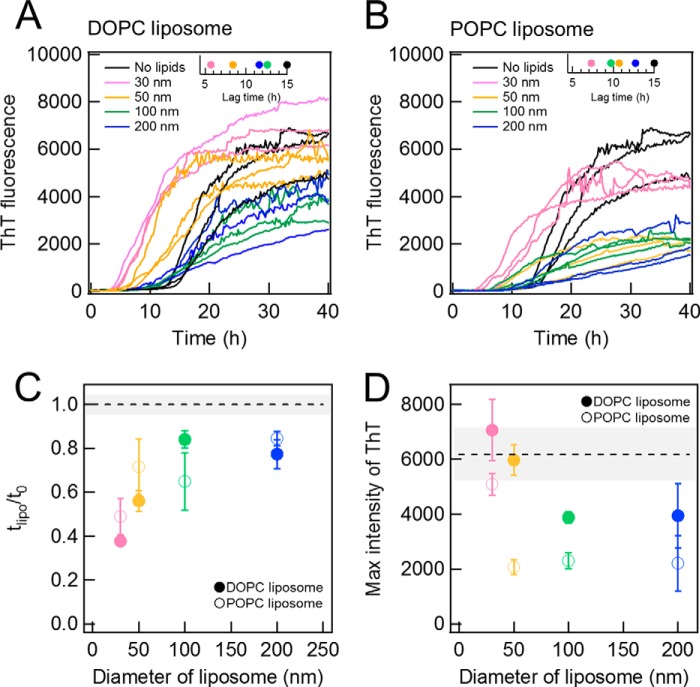
FIGURE 3.
Effects of liposomes of various sizes on Aβ amyloid fibrillation. A and B, kinetics monitored by ThT fluorescence in the absence (black) or presence of DOPC (A) or POPC (B) liposomes of 30 (pink), 50 (yellow), 100 (green), or 200 nm (blue) at 37 °C without shaking. Liposome and Aβ concentrations were 10 μm. The insets show the average lag times. C and D, dependences of the relative lag time (C) and maximal ThT amplitude (D) on the liposome size. Dotted lines are the values obtained in the absence of liposomes. The error bars and gray zones indicate the S.D. among three experiments.

