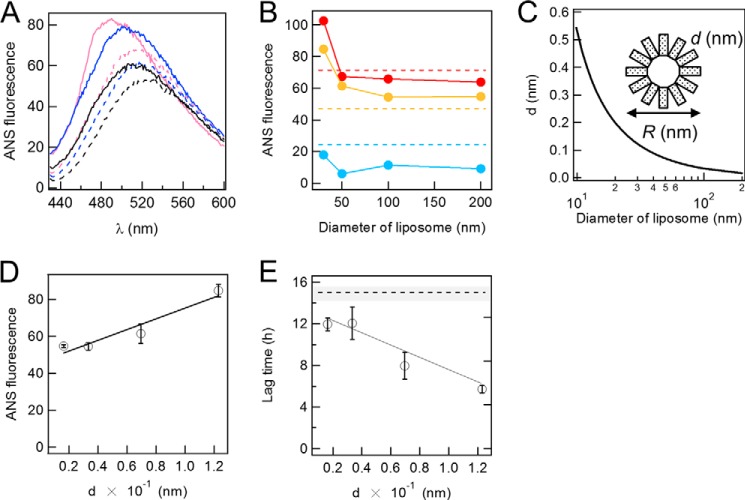
FIGURE 4.
Exposed hydrophobicity of liposomes and its effects on the fibrillation of Aβ. A, fluorescence spectra of 2 μm ANS in the absence and presence of 2 μm DOPC liposomes and 2 μm Aβ fibrils. Black dotted line, ANS alone; black solid line, Aβ fibrils; blue dotted line, liposomes of 200 nm in diameter; blue solid line, Aβ fibrils and DOPC liposomes of 200 nm in diameter; magenta dotted line, liposomes of 30 nm in diameter; magenta solid line, Aβ fibrils and liposomes of 30 nm in diameter. B, ANS fluorescence (20 μm) at the maximal wavelength in the presence of 2 μm liposomes at various diameters in the presence (red) and absence (orange) of 2 μm Aβ fibrils. Blue circles indicate the difference between the presence and absence of Aβ fibrils. C, the relationship between the distance, d, between two head groups of lipids, and the diameter of DOPC liposomes. D and E, dependences of ANS fluorescence at 500 nm (D) and lag time (E) on d (distance). Dashed lines indicate the ANS fluorescence (B) or lag time (E) in the absence of liposomes. The error bars indicate the S.D. among three experiments. All experiments are conducted at 37 °C.

