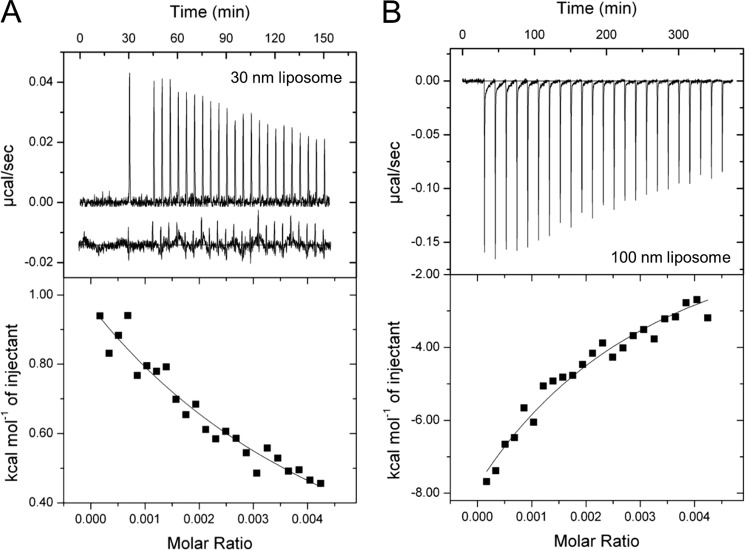
FIGURE 6.
Isothermal titration calorimetry of DOPC liposomes with Aβ-(1–40). A and B, ITC thermograms (upper panel) and binding isotherms (lower panel) on titrating 30-nm (A) or 100-nm (B) liposomes with Aβ-(1–40) are shown. ITC thermograms were obtained after the base-line correction. The spacing time between the first and second titrations was 900 s in A. The inset in A below the thermogram of Aβ titration indicates the small endothermic heat of dilution and mixing on Aβ-(1–40) to buffer. The same scale of heat was used for comparison. The concentrations of liposomes were expressed by the molar ratio in the binding isotherms of those of lipid monomers based on the study by Otzen and co-workers (53). The solid lines in the lower panels indicate the fitted curves.

