
FIGURE 1.
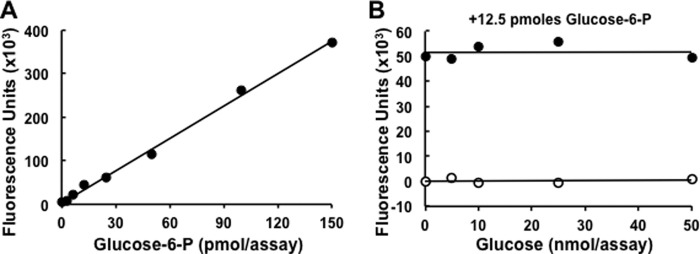
Assay of glucose 6-P. A, standard curve for the measurement of glucose 6-P using the assay described under “ Experimental Procedures.” B, analysis of a fixed amount of glucose 6-P (12.5 pmol/assay) in the presence of 0–50 nmol/assay of glucose, mimicking the background of free glucose that could result from the hydrolysis of glycogen or starch.