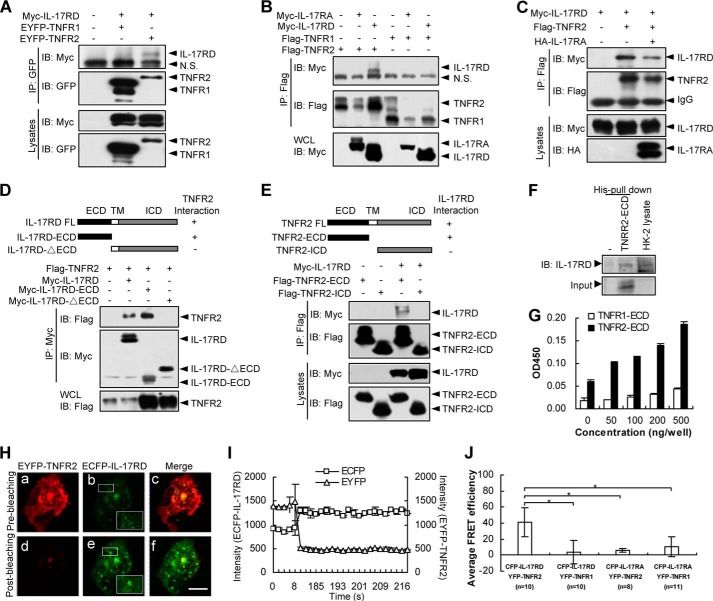
FIGURE 3.
IL-17RD associates with TNFR2 in vitro. A, IL-17RD interacts with TNFR2 in HEK293T cells. The protein complex was immunoprecipitated (IP) by an anti-GFP antibody and resolved by an anti-Myc or anti-GFP antibody. IB, immunoblot. B, IL-17RA fails to interact with TNFR1 and TNFR2. An IP experiment was performed for HEK293T cells. C, IL-17RA interferes with the association of TNFR2 and IL-17RD. D and E, extracellular domains of IL-17RD and TNFR2 are responsible for the IL-17RD·TNFR2 interaction. IPs were performed using an anti-Myc (D) or anti-FLAG (E) antibody, respectively. Immunoblotting was performed using the indicated antibodies. ICD, intracellular domain; TM, transmembrane. F, TNFR2-ECD interacts with endogenous IL-17RD in HK-2 cells. The protein of His-TNFR2-ECD was added to the cell lysates from HK-2 cells, and the complex was precipitated with His column and resolved by an anti-IL-17RD antibody. G, an ELISA assay for binding of IL-17RD-ECD to TNFR2-ECD or TNFR1-ECD. Microtiter plates were coated with various amounts (0–500 ng) of TNFR2-ECD or TNFR1-ECD. After blocking, 500 ng of IL-17RD-ECD were added to each well, and the bound protein from the liquid phase was detected by an antibody against IL-17RD (3F12) followed by a secondary antibody conjugated with horseradish peroxidase. H and I, FRET assays in COS-7 cells. IL-17RD was engineered into ECFP, and TNFR2 was engineered into EYFP. The plasmids were co-transfected in COS-7 cells. IL-17RD and TNFR2 FRET signals were taken before photobleaching (a–c) and after photobleaching (d–f). Scale bars, 10 μm (H). The emission spectra of ECFP-IL-17RD and EYFP-TNFR2 were shown (I). J, a statistic analysis of the averaged FRET efficiency (%). n indicates the numbers of cells observed. Data are presented as the average ± S.D. *, p < 0.05. EYFP, enhanced yellow fluorescent protein; ECFP, enhanced cyan fluorescent protein.

