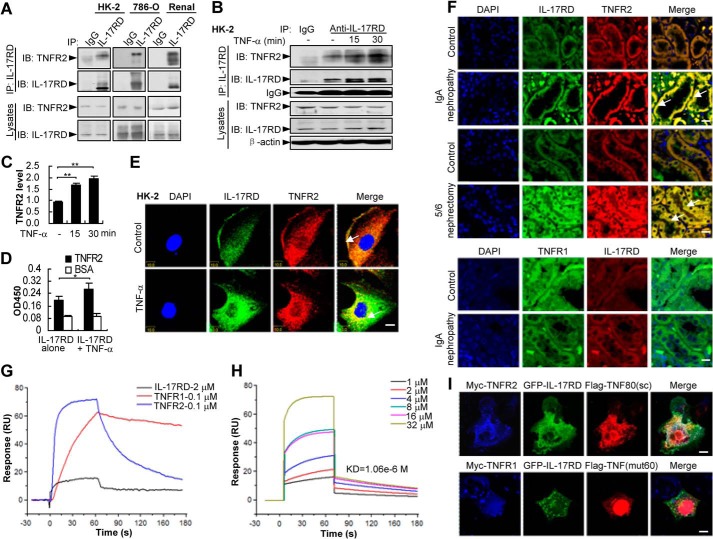
FIGURE 4.
TNF-α facilitates the association of IL-17RD and TNFR2. A–C, IL-17RD exists in vivo as a complex with endogenous TNFR2. Endogenous IL-17RD interacts with TNFR2 in HK-2, 786-O cells, and renal tissues of mouse (A). HK-2 cells treated with or without TNF-α were used for IP experiments (B). IB, immunoblot. The relative density of TNFR2 precipitated from three independent IP experiments was quantified and presented as average ± S.D. **, p < 0.01 (C). D, an ELISA assay for the binding ability of IL-17RD-ECD with TNFR2-ECD (500 ng/well) in the absence or presence of equal amounts of TNF-α. *, p < 0.05. E and F, IL-17RD co-localizes with TNFR2 in RTECs. HK-2 cells stimulated without (control) or with TNF-α (E) and the sections from kidneys of IgA nephropathy and 5/6 nephrectomy rats and the controls (F) were immunostained with anti-TNFR2 (or anti-TNFR1) and anti-IL-17RD antibodies. Arrows indicate the co-localization of IL-17RD and TNFR2. Scale bars: E, 10 μm; F, 20 μm. G and H, surface plasmon resonance analyses for the binding affinities of TNF-α to IL-17RD, TNFR1, and TNFR2. Proteins of TNFR1-ECD (0.1 μm) or TNFR2-ECD (0.1 μm) and different concentrations of IL-17RD-ECD (1, 2, 4, 8, 16, 32 μm) were injected using FastStep injection, and dissociation of analyte-ligand complexes was monitored. KD for each interaction is indicated. RU, response units. I, co-localization of IL-17RD with TNFR2 and TNF80(sc). COS-7 cells were co-transfected with indicated plasmids. Cells were analyzed by double immunostaining with anti-Myc/FLAG antibodies. Scale bar: upper panel, 25 μm; lower panel, 10 μm.

