VOLUME 287 (2012) PAGES 26068–26076
PAGE 26075:
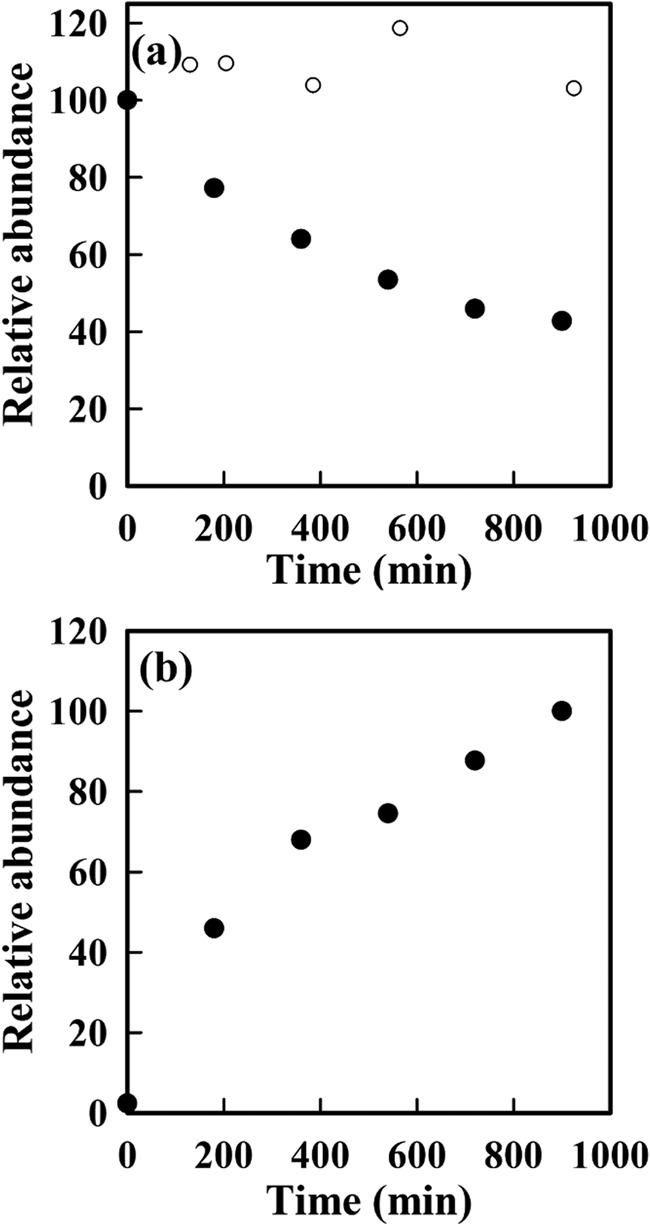
Fig. 6 has been revised to correct an error in the quantification of GSH adducts. The data points in the original Fig. 6A were mistakenly calculated for only one of the major GSH adduct peaks (shown in Fig. 4B), giving a false impression of a lag between substrate loss and product formation. This is not the case when all product peaks are integrated (as they do not decay at the same rate). The corrected figure shows integration for all of the peaks. The open circles in Fig. 6B were at zero on the y axis and indicated that no product was formed when the reduced GSH adduct was incubated over time. The data correspond to the open circles in Fig. 6A showing no loss of starting material. Rather than showing the zero points, the legend has been revised to indicate that no reduced hydroxide was detected in the sample reduced with NaBH4. These corrections do not affect the interpretation of the results or the conclusions of this work.
FIGURE 6.

Time course for dissociation of the GSH adduct of ELGYQG and prevention by NaBH4 reduction. Loss of GSH adduct without (●) or with NaBH4 reduction (○) is shown. a, the GSH adduct was prepared as in Fig. 4 with and without NaBH4 reduction (20 mm for 30 min) then reacted with iodoacetamide (10 mm in the dark). Samples were removed at intervals and analyzed by LC-MS with SRM at m/z 495.2→449.3 for the non-reduced and m/z 496.2→450.3 for the reduced GSH adduct. The amount of adduct at time zero is set at 100%. b, time course for recovery of the hydroxide (●), monitored by SRM at m/z 682.3→589.4. Reduced hydroxide monitored by SRM at m/z 684.3→591.4 was not detected in the sample reduced with NaBH4. The amount of hydroxide measured at 900 min was set at 100%.


