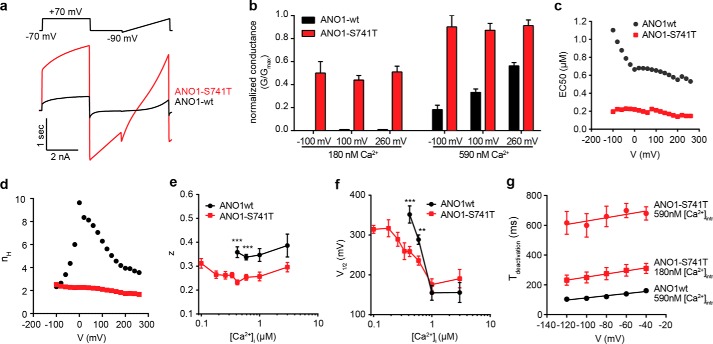
FIGURE 6.
Electrophysiological characterization of ANO1-S741T. a, representative whole-cell current traces recorded for ANO1-WT and ANO1-S741T at 415 nm intracellular free calcium. Voltage protocol as shown in the figure. b, normalized conductance (G/Gmax) of ANO1-WT and ANO1-S741T. G has been normalized to the individual maximal conductances at the specified voltage. c, EC50 value of the calcium-dependent activation of ANO1-WT and ANO1-S741T at the indicated membrane potentials. EC50 values were obtained from fitting of the mean [Ca2+]i − whole-cell conductance response relationship with the Hill-Langmuir equation. The mean conductance at a given potential and [Ca2+]i was obtained by averaging conductances measured in n = 4–50 and n = 4–64 cells for ANO1-WT and ANO1-S741T, respectively. d, Hill coefficient across a range of membrane potentials from the same fit as described in a. e, plot of the estimated membrane potential producing half-maximal activation (V½) of ANO1-WT/S741T versus the concentration of intracellular free calcium. V½ was obtained from fitting a Boltzmann equation to the voltage dependence of normalized whole-cell conductance at a given [Ca2+]i. The maximum conductance Gmax was estimated from the fit of the voltage dependence of G at 1 μm free [Ca2+]i, and G at each [Ca2+]i was then normalized to the same Gmax. n = 9–45. f, plot of the estimated gating charge (z) associated with voltage-dependent channel opening of ANO1-WT/S741T versus the concentration of intracellular free calcium. Fitting of data as described in e. g, kinetic analysis of the deactivation time of ANO1-WT/S741T. Tail currents were fitted to single exponentials, and the time constants were plotted versus membrane potential. n = 5–15. **, p < 0.01; ***, p < 0.001.

