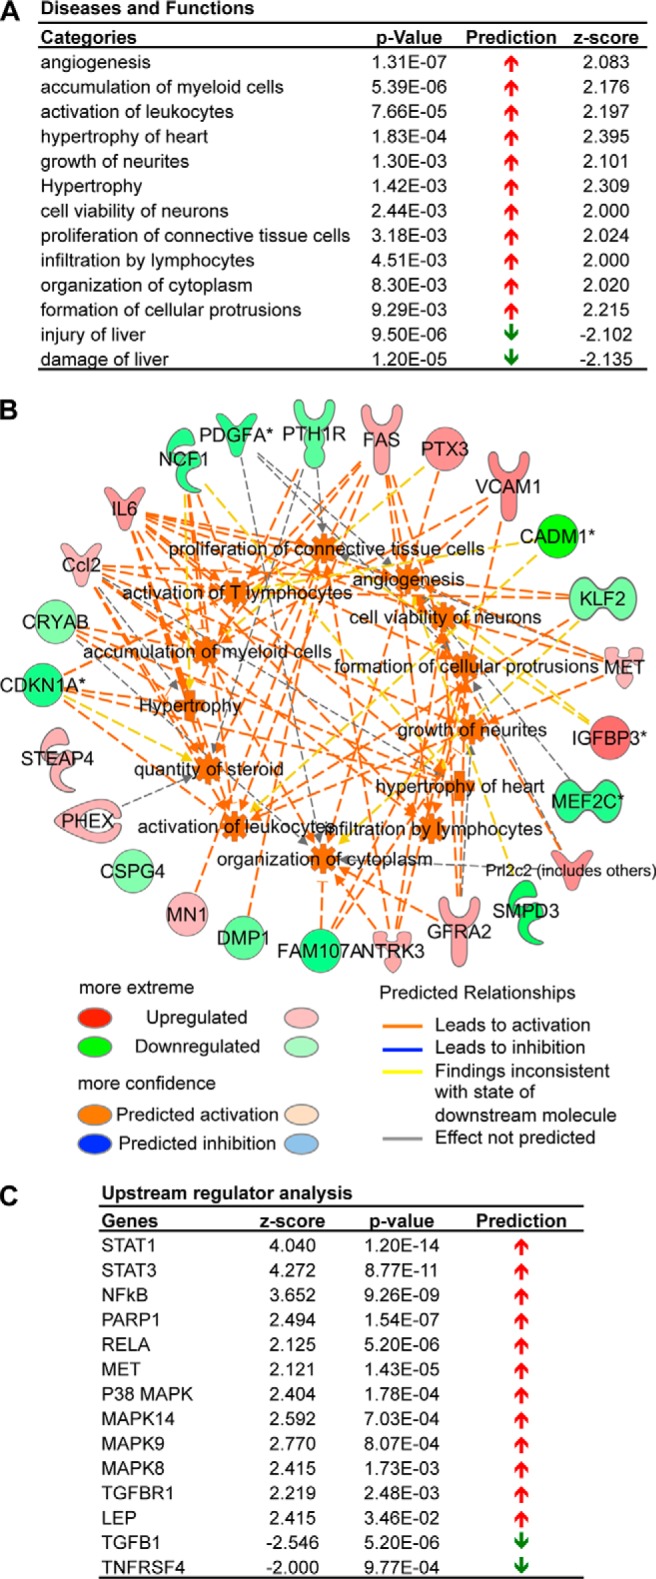
FIGURE 5.

Transcriptomics analysis of Chadl shRNA knockdown in ATDC5 cells. A, diseases and biological functions for the differentially expressed genes with their respective activation p values, prediction states, and activation z scores. B, a network indicating the effects of the differentially regulated genes (outer circle) on individual diseases and functions categories (inner circle). C, identification of regulator cascades upstream of the observed transcriptional changes by upstream regulator analysis.
