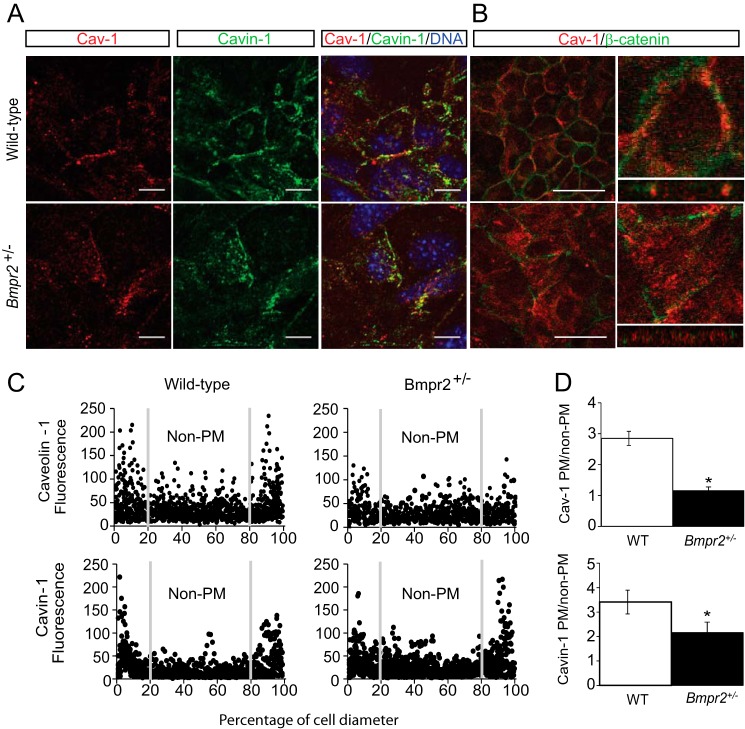
FIGURE 1.
Mislocalization of caveolar structural proteins in Bmpr2+/− PECs. A, representative immunofluorescence images of CAV-1 (red) and Cavin-1 (green) in wild-type and Bmpr2+/− PECs. Scale bars, 10 μm. B, left panels, single x/y plane from z-stack images. Caveolin-1 (red) and β-catenin (green). Scale bars, 50 μm. Right panels, orthogonal views reconstructed from z-stack images depicting Caveolin-1 localization in x/z and y/z planes of a single cell magnified from the left panels. C, fluorescence intensity plots depicting CAV-1 and Cavin-1 distribution across the cells. Gray lines delineate plasma membrane (PM) from non-plasma membrane. Plots were generated from multiple cells from three wild-type (n = 12) and three Bmpr2+/− (n = 14) cell lines. Fluorescence is in arbitrary units, and distance is in percentage of cell diameter. D, quantitative analysis of CAV-1 and Cavin-1 localization. Values are expressed as the mean ratio of plasma membrane to non-plasma membrane fluorescence intensities. Error bars represent S.E. *, p < 0.05 versus wild-type controls (t test).

