FIGURE 3.
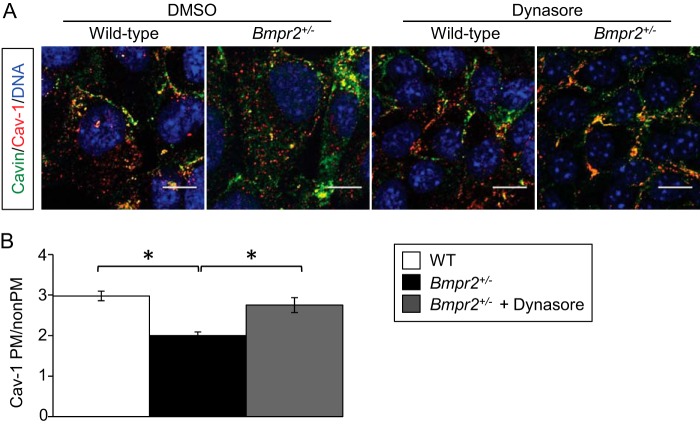
Dynamin-2 inhibition restores CAV-1 localization to the plasma membrane in Bmpr2+/− PECs. A, CAV-1 and Cavin-1 localization after dynasore treatment. Representative immunofluorescence images demonstrate CAV-1 and Cavin-1 localization following vehicle or 80 μm dynasore treatment for 30 min. Scale bar, 10 μm. B, quantitative analysis of CAV-1 localization after dynasore treatment. Values are expressed as the mean ratios of plasma membrane (PM) to non-plasma membrane fluorescence intensities in multiple cells from three wild-type lines (n = 100), three untreated Bmpr2+/− lines (n = 100), and two Bmpr2+/− lines after dynasore treatment (n = 60). Error bars represent S.E. *, p < 0.001 (one-way ANOVA with Dunnett's correction for repeated comparisons with untreated Bmpr2+/− PECs).

