FIGURE 4.
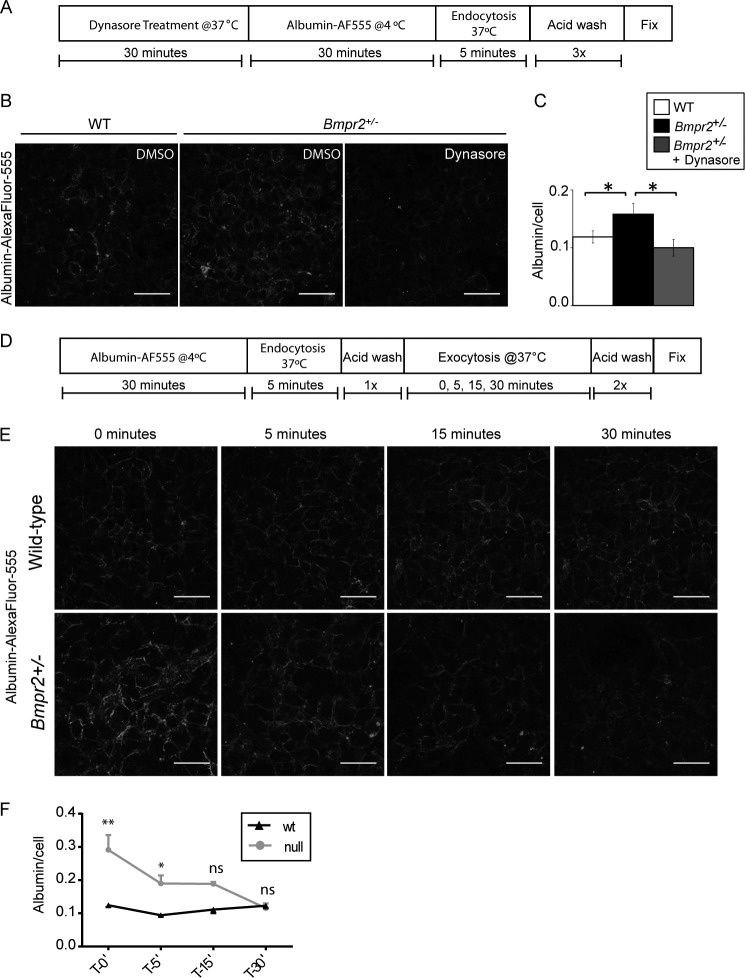
Bmpr2+/− PECs have increased caveolar endocytosis but exhibit normal exocytosis. A, schematic illustrating experimental setup in B. B, increased albumin uptake in Bmpr2+/− PECs is ablated in Bmpr2+/− PECs pretreated with dynasore. Representative immunofluorescence images demonstrate albumin localization following vehicle or 80 μm dynasore treatment for 30 min. Cells were incubated in 0.1 mg/ml albumin-Alexa Fluor (AF) 555 for 5 min at 37 °C in DMSO or dynasore as indicated followed by acid stripping to removed membrane-bound albumin as outlined in A. Scale bars, 50 μm. C, quantitative analysis of albumin uptake in B. Values are expressed as the mean fluorescence intensity divided by total cell number. Error bars represent S.E. *, p < 0.05 (one-way ANOVA with Dunnett's correction for multiple comparisons with untreated Bmpr2+/− PECs). D, schematic illustrating experimental setup in E. E, representative immunofluorescence images demonstrating albumin exocytosis following 5 min of endocytosis. Cells were incubated in 0.1 mg/ml albumin-Alexa Fluor 555 for 5 min at 37 °C followed by one round of acid stripping. Cells were then returned to 37 °C for the indicated times and subsequently fixed. Scale bars, 50 μm. F, quantitative analysis of albumin exocytosis in E. Values are expressed as the mean fluorescence intensity divided by total cell number. Error bars represent S.E. *, p < 0.01; **, p < 0.0001; ns, not significant (two-way repeated measures ANOVA with Šidák's correction for multiple comparisons with Bmpr2+/− PECs). ′, minutes.

