FIGURE 5.

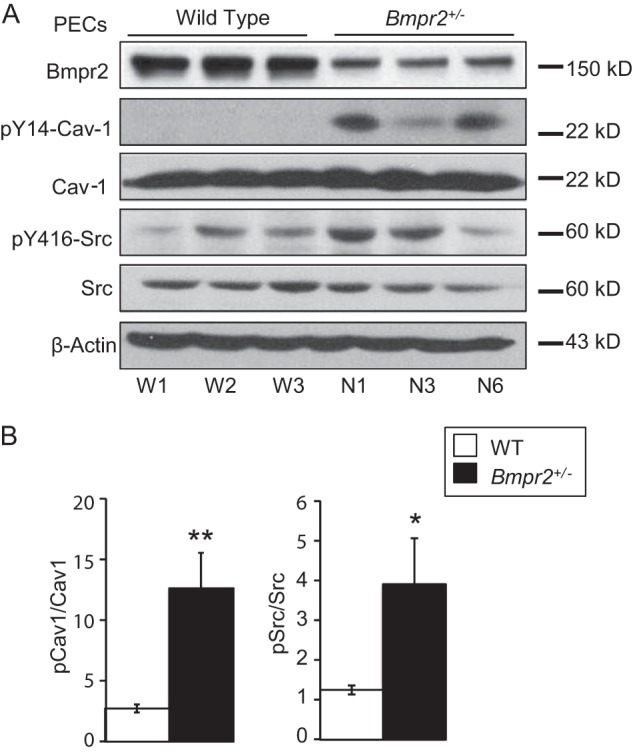
Increased SRC and CAV-1 phosphorylation in Bmpr2+/− PECs. A, Western blots demonstrating basal expression of phosphorylated Tyr14-CAV-1 and Tyr416-SRC and total BMPR2, CAV-1, and SRC kinase from three wild-type (W1, W2, and W3) and three Bmpr2+/− (N1, N3, and N6) PEC lines. β-Actin serves as a loading control. B, quantitative analysis of Western blot band densitometry values from four independent experimental replicates for a total of 12 samples per genotype. Values are expressed as the mean ratios of band densities as indicated. Error bars represent S.E. *, p < 0.0001; **, p < 0.001 versus wild-type controls (t test). Gels were run and probed as follows: Gel 1, BMPR2; Gel 2, Tyr(P)14-CAV-1, Tyr(P)416-SRC, and β-actin; Gel 3, CAV-1 and SRC. pCav1, phosphorylated CAV-1; pSrc, phosphorylated SRC.
