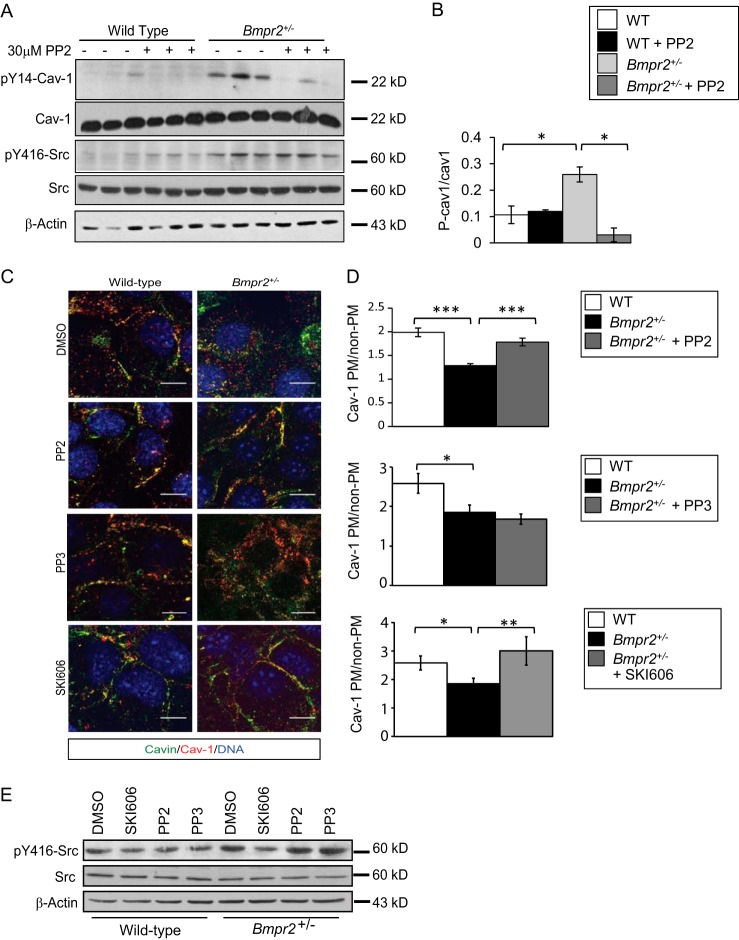
FIGURE 8.
SRC inhibition with PP2 reduces Tyr(P)14-CAV-1 and restores CAV-1 localization to the plasma membrane in Bmpr2+/− PECs. A, PP2 inhibits Tyr14-CAV-1 phosphorylation. Cells were treated with 30 μm PP2 for 30 min prior to cell lysis. The experiment was performed in triplicate in one wild-type line (W1) and one Bmpr2+/− line (N1). SRC inhibition is demonstrated by reduced phosphorylation of the SRC target Tyr(P)14-CAV-1. B, quantification of band densitometry in A. Values are expressed as the mean ratios of band densities as indicated. Error bars represent S.E. *, p < 0.01 versus wild-type controls (t test). P-cav1, phosphorylated CAV-1. C, CAV-1 and Cavin-1 localization after PP2, PP3, or SKI606 treatment. Representative immunofluorescence images show CAV-1 and Cavin-1 localization after treatment. Scale bars, 10 μm. D, quantitative analysis of CAV-1 localization after treatment. Values are expressed as the mean ratio of plasma membrane (PM) to non-plasma membrane fluorescence intensities in multiple cells from one wild-type (W1; n = 45) and one Bmpr2+/− line (N1; n = 75) before and after PP2 treatment (W1, n = 33; N1, n = 35; N1 PP3, n = 10; N1 SKI606, n = 14). Error bars represent S.E. *, p < 0.05; **, p < 0.01; ***, p < 0.0001 (one-way ANOVA with Dunnett's and the Holm-Šidák correction for comparisons with untreated Bmpr2+/− PECs, respectively). E, SKI606 inhibits SRC phosphorylation at Tyr416. Cells were treated with 30 μm PP2, 30 μm PP3, or 1 μm SKI606 for 30 min prior to cell lysis. Gels were run and probed as follows: A, Gel 1, Tyr(P)14-CAV-1, Tyr(P)416-SRC, and β-actin; Gel 2, CAV-1 and SRC; E, Gel 1, Tyr(P)416-SRC; Gel 2, SRC and β-actin.

