FIGURE 5.
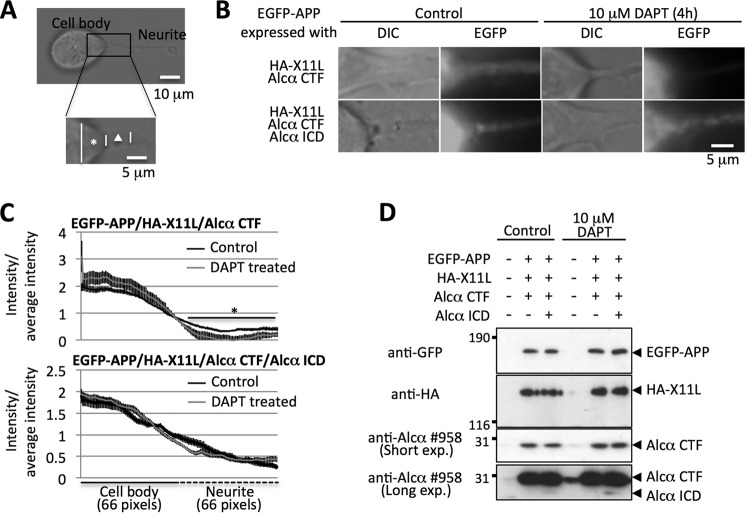
Alcα ICD facilitates the trafficking of APP into neurites. A, the proximal region of neurites for analysis of APP trafficking. Neuro2a cells were observed under a transmission light and the hillock of cell body (asterisk, cell body) and the proximal region of neurite (triangle, neurite) were analyzed for EGFP-APP fluorescence as described under “Experimental Procedures.” B, representative images of the fluorescence of EGFP-APP. The fluorescence of EGFP-APP was observed in living cells expressing HA-X11L and Alcα CTF in the presence (top) or absence (bottom) of Alcα ICD expression. Analyses were performed in the presence or absence of DAPT treatment (10 μm for 4 h). C, quantifications of fluorescence intensities of EGFP-APP at the proximal region of neurites. The intensities of EGFP-APP in B were quantified. The left panel indicates the intensity of cell body, and the right panel indicates the intensity of neurite. The fluorescence intensity of cell body or neurite is shown as a ratio to average intensity of cell body plus neurite. Black (control) and gray (DAPT-treated) lines are shown. The values are indicated with mean ± S.E. (n = 9–14). *, p < 0.05, Student's t test. D, levels of protein expression in cells. Lysates of Neuro2a cells with or without DAPT treatment were analyzed by immunoblotting with anti-GFP no. 598 (MBL), anti-HA 12CA5 (Roche Applied Science), and anti-Alcα 958 (for Alcα CTF and Alcα ICD) antibodies. Detected proteins are indicated with arrowheads. Transfection of plasmids is indicated with a plus sign, whereas a minus indicates the use of empty plasmid alone. Numbers indicate the protein molecular mass standards.

