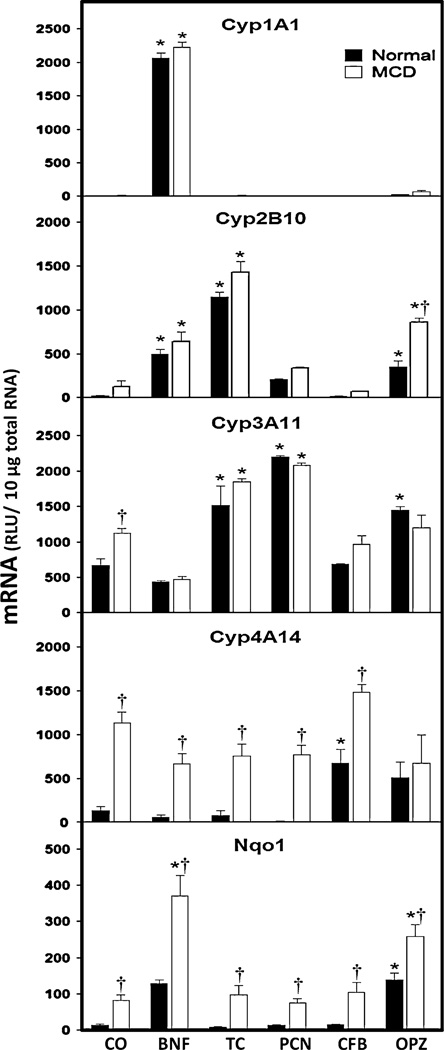
Fig. 2.
Hepatic mRNA levels of drug metabolizing enzymes in experimental NASH. Total hepatic RNA from normal diet-fed and MCD diet-fed mice was analyzed for Cyp1A1, Cyp2B10, Cyp3A11, Cyp4A14 and Nqo1 mRNA levels by branched DNA assay. Data is expressed as relative light units (RLU) ± standard error of mean. Asterisks indicate significant difference between corn oil and xenobiotic inducer treatment within respective diet group (*) (p < 0.05). Daggers indicate significant difference between normal and MCD diet groups when administered a specific xenobiotic inducer (†) (p < 0.05)

