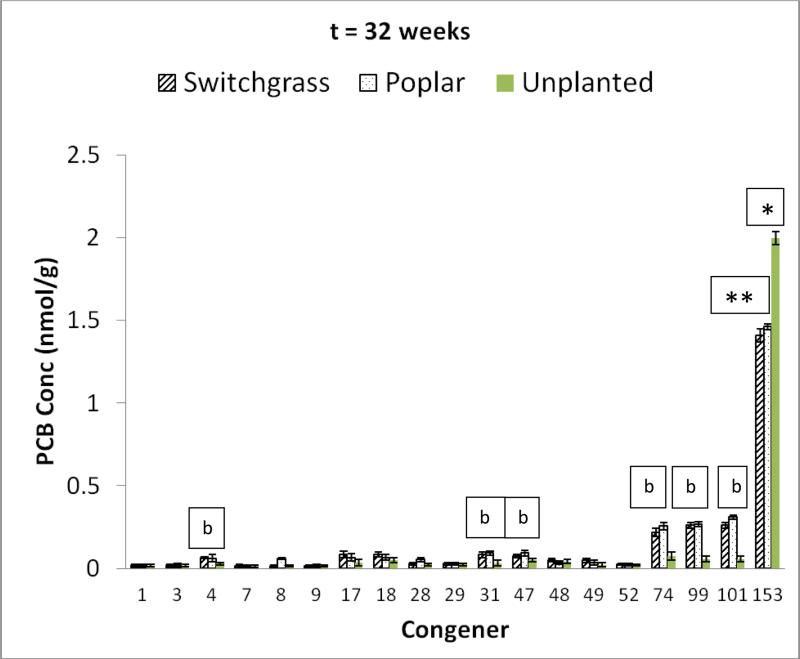
Figure 6.
PCB congener profile for soil contaminated with PCB 153 and undergoing alternate cycles of flooding and no flooding after 32 weeks of exposure. b = significant increase in concentration of PCB congener for the planted system when compared to unplanted system (p<0.05). The single “b” is for both switchgrass and poplar. The PCB congener concentrations in the switchgrass and poplar planted systems were statistically similar (p<0.05). *= significant decrease in parent PCB concentration in comparison to initial concentration (p<0.05). There was significant decrease in parent PCB congener in both the planted and unplanted systems, but significantly higher decline in the planted systems compared to the unplanted system. Error bars are 1 standard deviation

