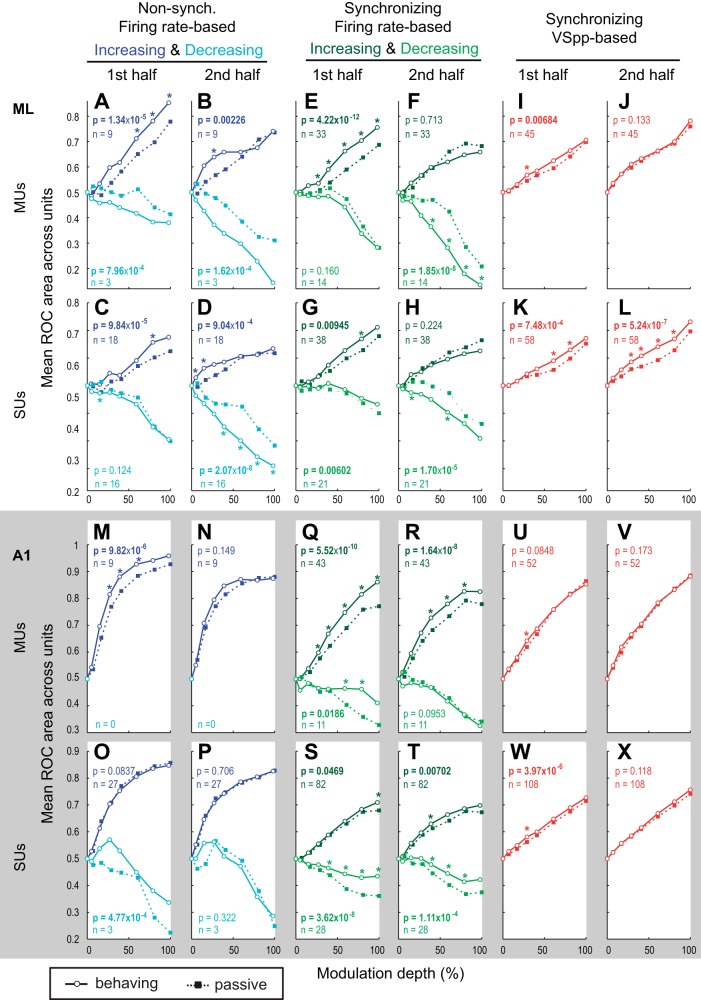
Fig. 12.
Effect of task engagement on AM discriminability shown separately for synchronized/nonsynchronized and increasing/decreasing responses. A and B: ML population mean rate-based ROCas for nonsynchronized responses plotted for increasing (dark blue lines) and decreasing (light blue lines) responses, during 1st half (0–400 ms, A) and 2nd half (400–800 ms, B) for MUs (C and D for SUs). *Depths at which the differences between active and passive were significant (P < 0.05). P values at top of each subplot denote whether differences between active and passive were significant for increasing units collapsed across all depths, and those at bottom of each subplot are for decreasing units collapsed across all depths. E and F: population mean rate-based ROCas for synchronized responses plotted for increasing (dark green lines) and decreasing (light green lines) responses during 1st half (0–400 ms, E) and 2nd half (400–800 ms, F) for MUs in ML (G and H for SUs). Asterisks and P values are formatted as in A–D. I and J: population mean VSpp-based ROCas for synchronized responses during 1st half (80–400 ms, I) and 2nd half (400–800 ms, J) for MUs in ML (K and L for SUs). M–X: same as A–L, but for A1 units. In all panels, P values are denoted showing Wilcoxon signed-rank test comparing collapsed-depth ROC areas between behaving and passive conditions. *Individual modulation depths where a Wilcoxon signed-rank test yielded a value of P < 0.05.

