Fig. 4.
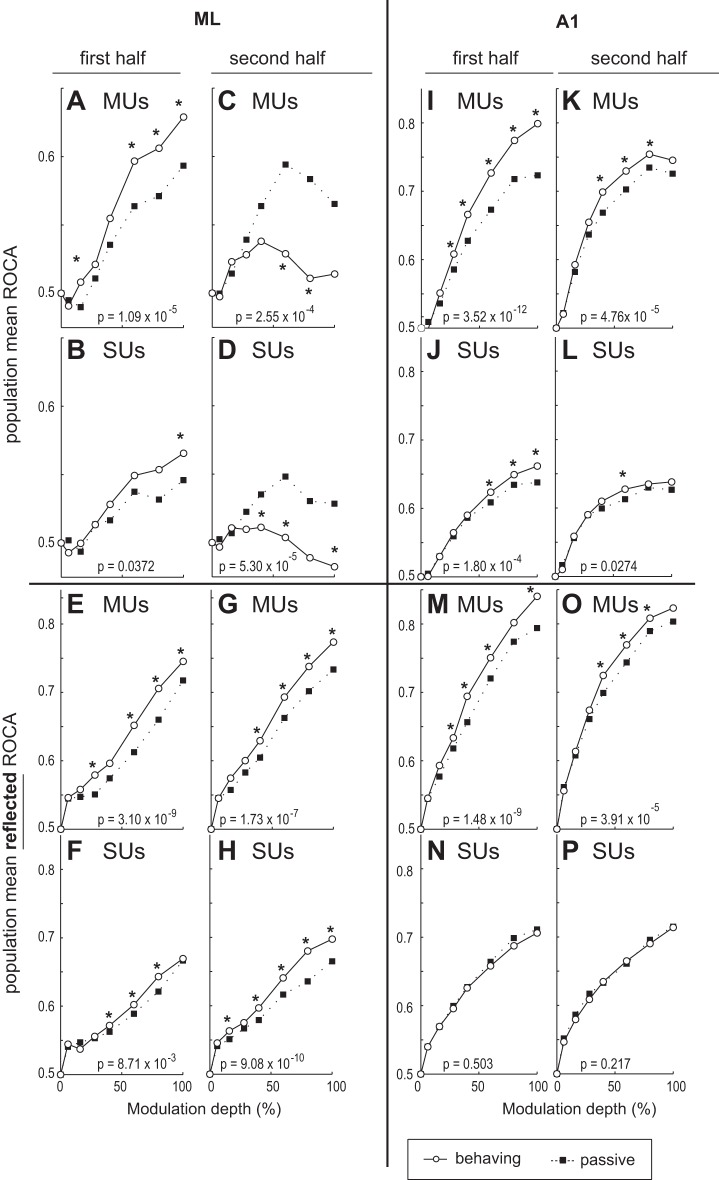
Population ROCa-depth functions for 1st and 2nd halves of the test stimulus in ML and primary auditory cortex (A1) neurons. A and B: ML population mean ROCas based on firing rate during the 1st half of the stimulus plotted as a function of modulation depth for the passive and behaving conditions for all recorded multiunits (MUs; A) and SUs (B) in ML. C and D: population mean, rate-based ROCas for the second 400 ms of the stimulus are shown for MUs (C) and SUs (D). E–H: plots are the same as in A–D except that ROCa is reflected around 0.5. This means the y-axis shows the absolute value of the difference in ROCa from 0.5. So, for example, an ROCa of 0.4 → reflected ROCa of 0.6 and an ROCa of 0.1 → reflected ROCa of 0.9, etc. I–L are the same as A–D except for A1. M–P are the same as E–H except for A1. In all panels, P values denote Wilcoxon signed-rank test comparing collapsed-depth ROC areas between behaving and passive conditions. *Individual modulation depths where a Wilcoxon signed-rank test yielded a value of P < 0.05.

