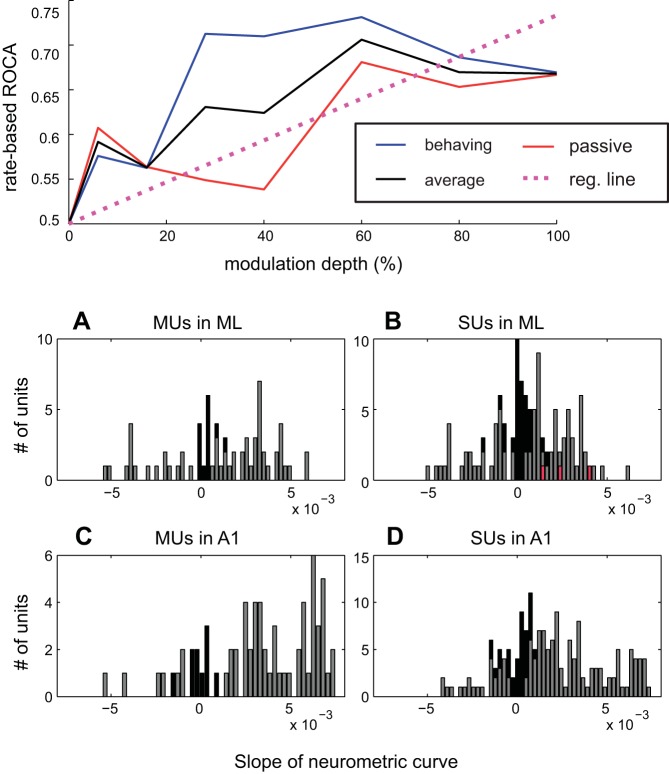
Fig. 5.
Top: demonstration of how the neurometric slope was calculated. A–D: distributions of the slopes of neurometric (ROCa vs. modulation depth) functions by linear regression for MUs in ML (A), SUs in ML (B), MUs in A1 (C), and SUs in A1 (D). The slopes of the 3 examples of Figs. 1–3 are shown in red (Fig. 1 neuron's slope = 0.0023, Fig. 2 neuron's slope = 0.0041, Fig. 3 neuron's slope = 0.0015).

