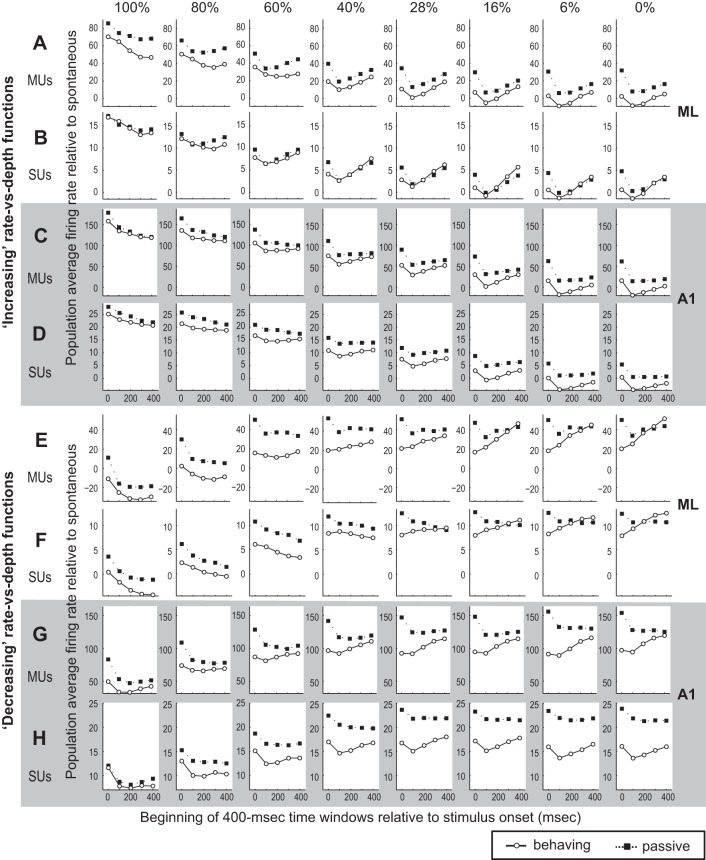
Fig. 9.
Firing rate relative to spontaneous rate is calculated in 400-ms time windows starting at various times (0, 100, 200, 300, and 400 ms) after stimulus onset. Layout is the same as Fig. 8 except that firing rate rather than ROCa is shown. The firing rate in response to unmodulated noise (0%) is included here, and changes in this contribute to changes in the neuron's ability to detect AM.

