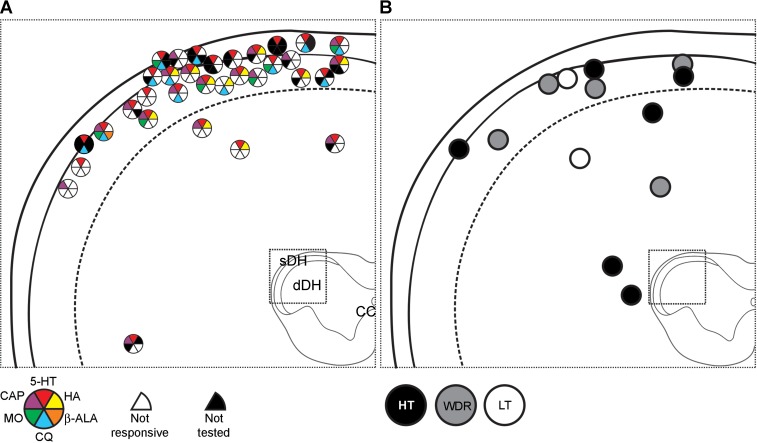
Fig. 8.
Recording points of all VcPbT neurons (n = 46). A: recording points of pruriceptive neurons at the level of C1. Responsiveness to the different agents tested is indicated by colored wedges and their position in the pie chart. A white wedge at the position of the respective agent indicates that the neuron was unresponsive to it; a black wedge indicates that the neuron was not tested for this agent. B: recording points of nonpruriceptive neurons and their mechanical classification. All recording point are illustrated at the level of C1, as all observed lesions were located in this segment or at the junction of this segment with the lower medulla or C2. HT, high threshold; LT, low threshold; WDR, wide dynamic range.

