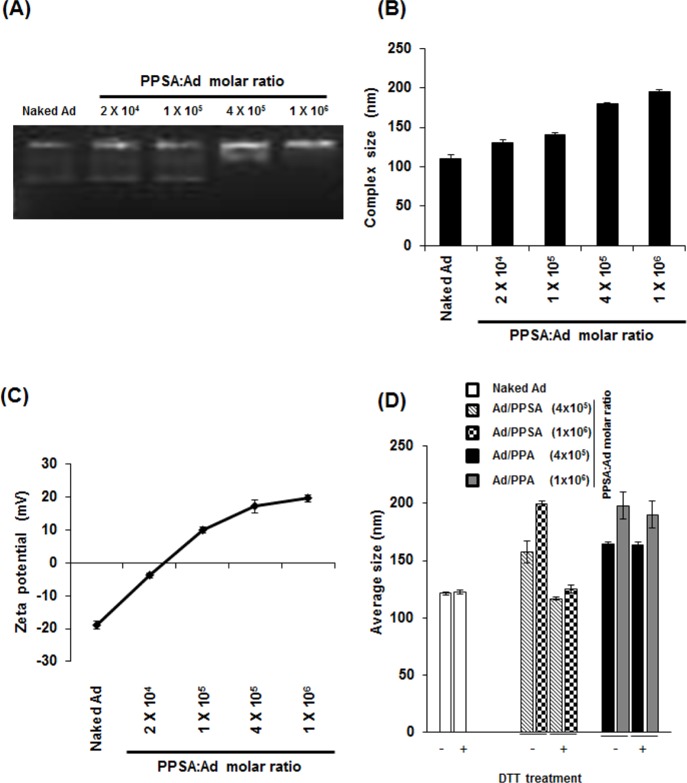
Figure 2.
Characterization of Ad/PPSA nanocomplex. (A) Optimal Ad/PPSA complex formation conditions were determined by gel retardation assay. (B) Average size distribution of naked Ad or Ad/PPSA at various molar ratios. (C) Zeta-potential value of naked Ad or Ad/PPSA at various molar ratios. The sizes and charges are the average of five independent experiments. (D) Average size distribution of Ad/PPSA and Ad/PPA complexes by DLS before and after treatment with DTT (5 mM) at 37 °C for 2 h.

