
Figure 4.
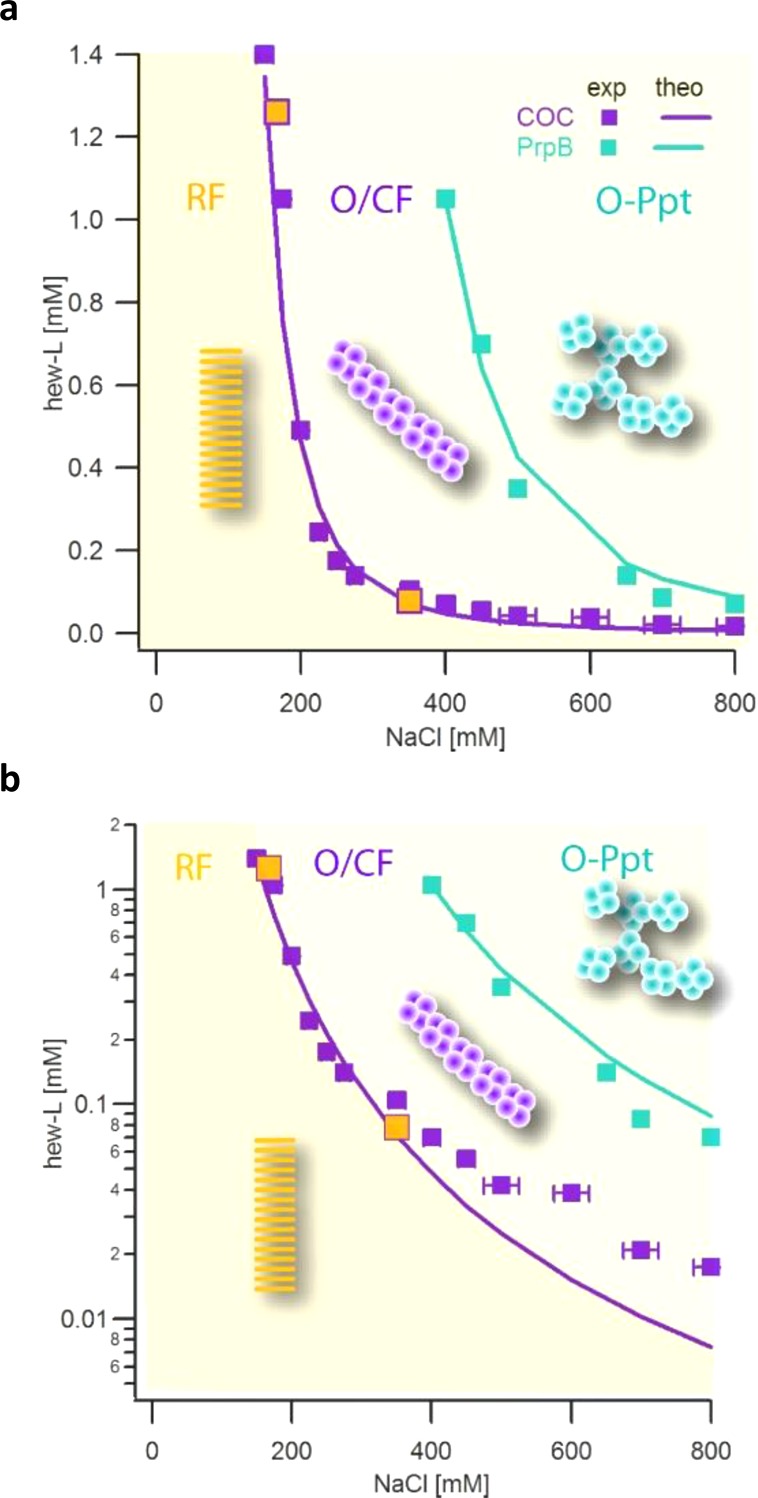
Experimental observations versus theoretical predictions of oligomer phase boundaries. Solid purple squares and their error bars indicate the experimentally determined COC for HEWL amyloid oligomers on a (a) linear and (b) semilogarithmic scale extracted from the data in Figure 2. Filled orange squares display CF solubility determined from relaxation data as those in Figure 3, panel a. Solid blue squares indicate the experimentally determined onset of oligomeric precipitate formation from the data in Figure 2. The yellow background indicates that RFs are the thermodynamic stable phase. The darker yellow shade delineates the region where only RF formation is observed. The lighter shade signifies the region for metastable O/CFs and O-Ppt formation. The solid purple and blue lines through the experimental oligomer phase boundaries are based on theoretical predictions from the colloidal model presented in the text.