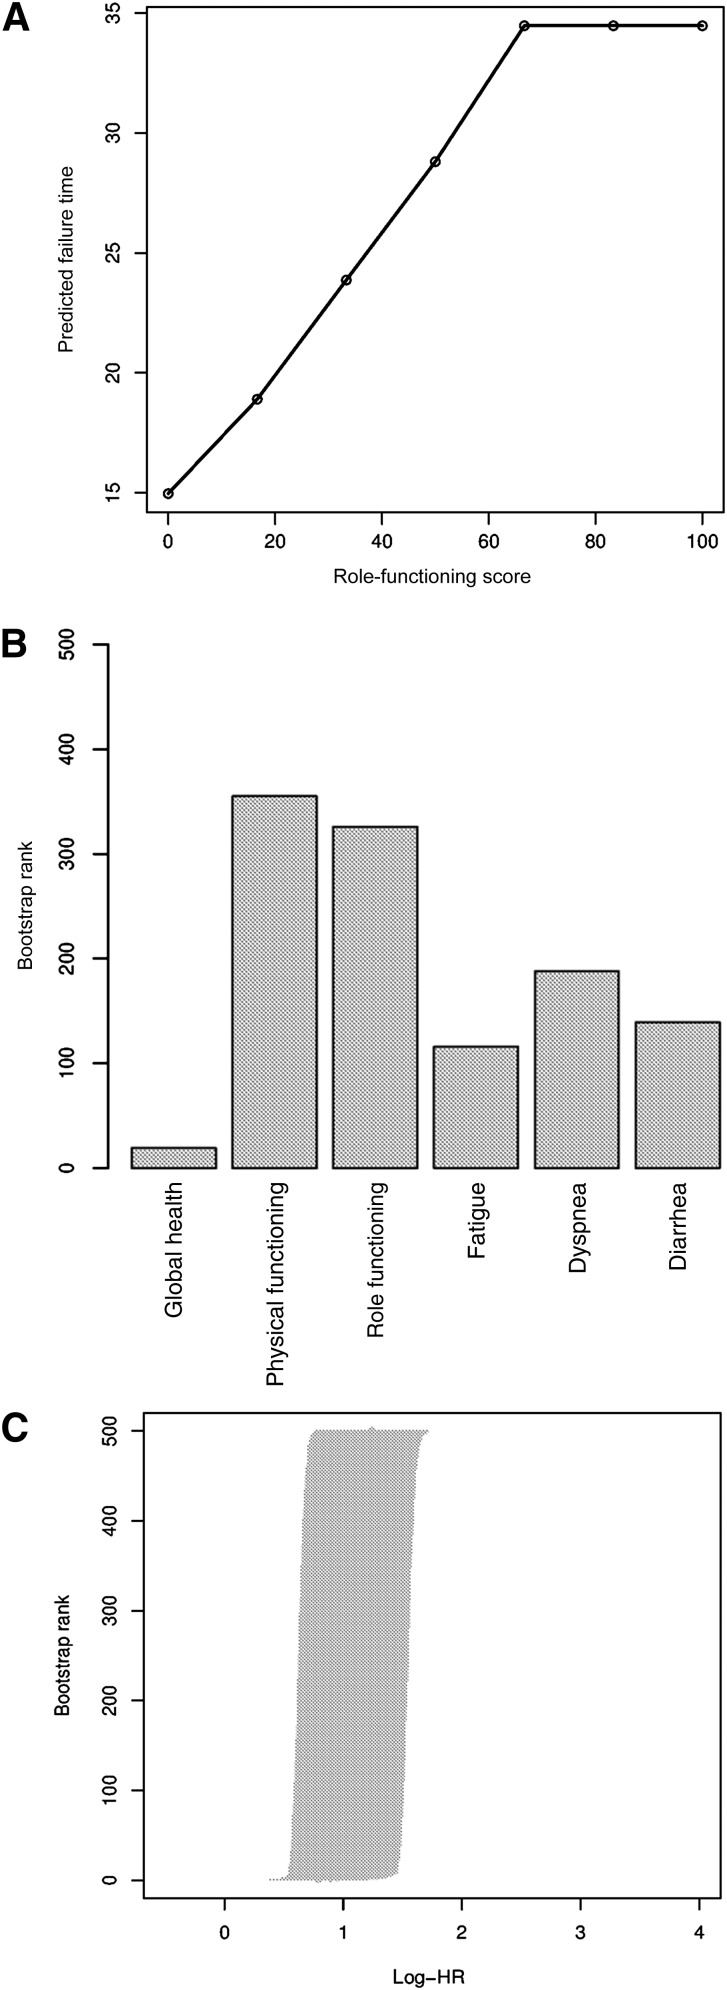
Figure 1.
Results of determination of optimal cut points for the Quality of Life Questionnaire-Core 30 (QLQ-C30) role functioning scale. (A): Scatter plot of predictive time to observe 20% of survivors as a function of role-functioning score. (B): Frequency with which the learning and validation samples found the same cutoff for the six quality-of-life scales (500 bootstrap replications). (C): The log-hazard ratio and 95% confidence interval ranks after 500 bootstrap replications for role-functioning score.
Abbreviation: HR, hazard ratio.

