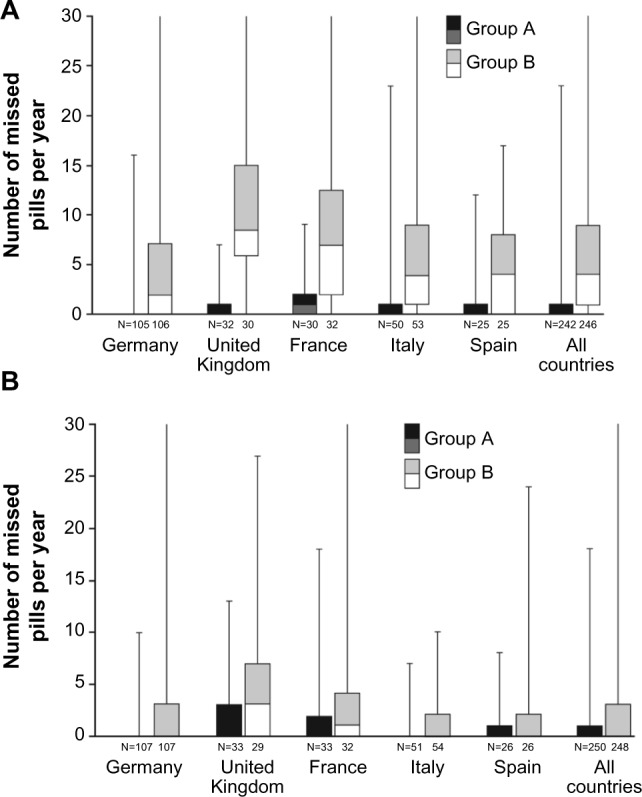
Figure 3.

Box and whisker plot for number of missed pills per year in group A (activated acoustic alarm) and group B (deactivated acoustic alarm) according to dispenser (A) and diary card data (full analysis set) (B).
Notes: Boxes range from Q1 to median (light) and from median to Q3 (dark) and whiskers range from minimum to maximum (cutoff at 30). If no box is displayed then Q3 is zero.
Abbreviation: Q, quartile.
