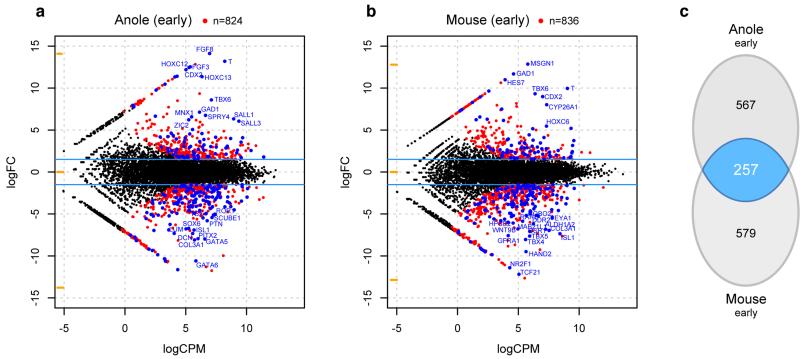
Extended Data Figure 8.
Pairwise differential expression analysis of tailbud and genitalia transcriptomes. a,b) Smear plot visualization of differential expression analyses of early anole (a) and early mouse (b) tailbud versus genitalia transcriptomes. Genes used as input for the Venn diagram in (c) (|log2(fold-change)| > 1.5; p-value < 0.05) are highlighted in red, overlapping 257 marker genes are highlighted in blue. Top 25 genes in the two species, based on logCPM and logFC, are labeled. c) Venn diagram showing overlap of pairwise differential expression analysis results (log(fold change) > 1.5, p-value < 0.05) of tailbud versus genital tissues, for early budding stages in both anole and mouse.

