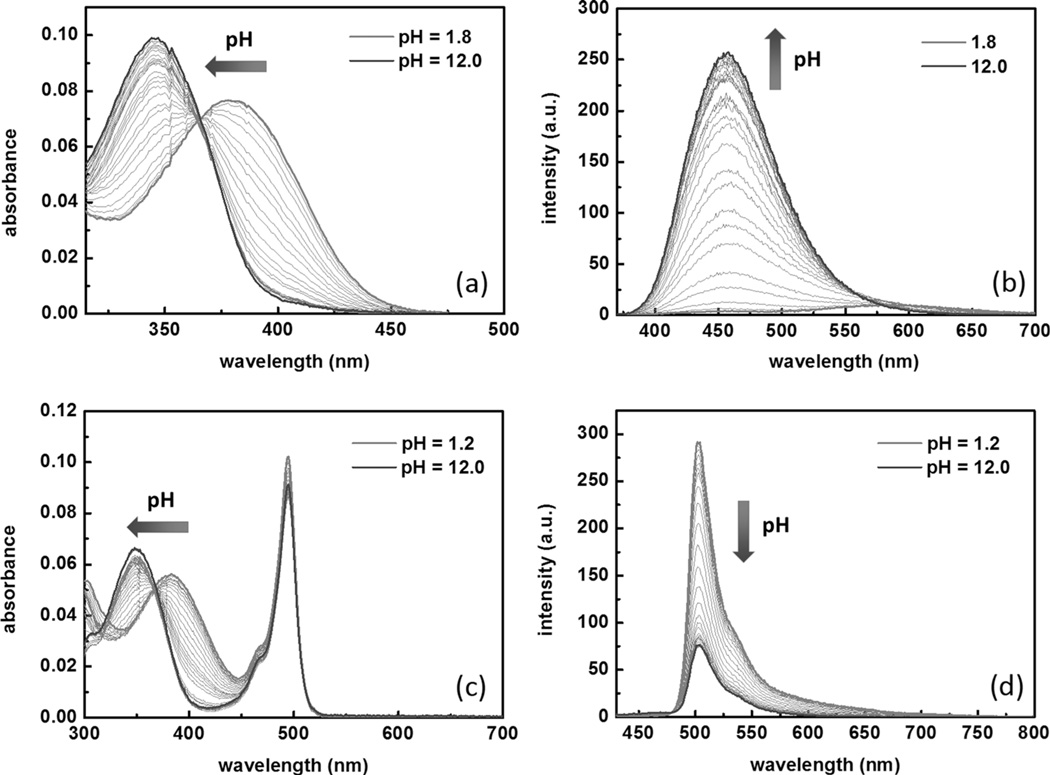
Figure 4.
Spectra of compounds 2 (2.0 µm) and 4 (2.0 µm) in a water/CH3CN mixture (1:1) containing HEPES (25 mm) and NaCl (25 mm). The increase in pH value follows the directions of the arrows. a) The absorption spectra of compound 2; b) the emission spectra of 2 (λex=360 nm); c) the absorption spectra of compound 4; and d) the emission spectra of 4 (λex=405 nm).

