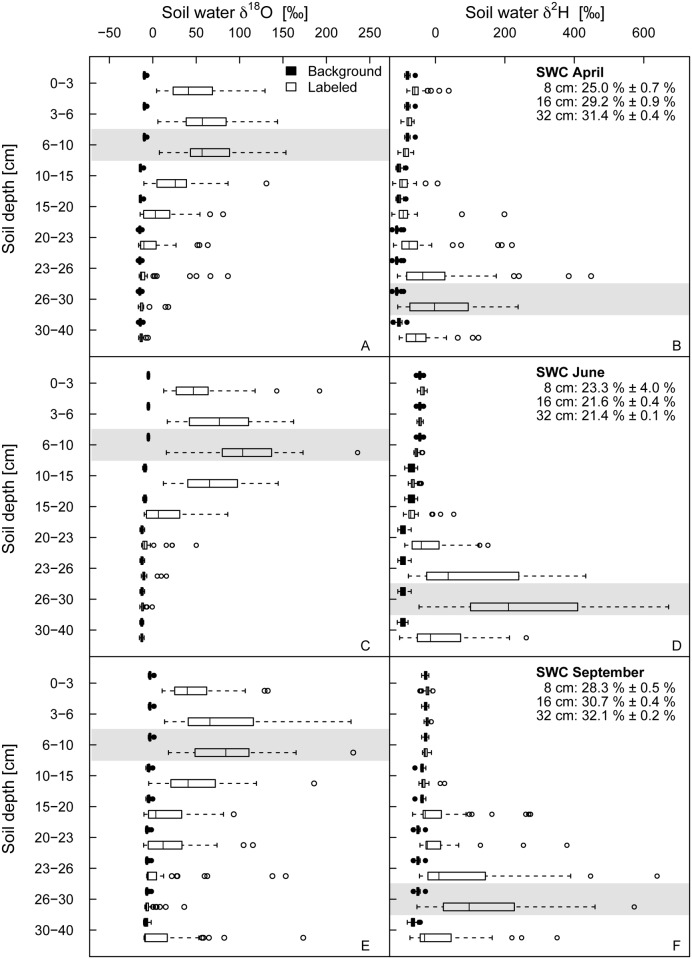
Figure 1. δ18O and δ2H values of soil water before and after the labeling.
δ18O (A, C, E) and δ2H (B, D, F) values of soil water labeled with 18O-enriched water in upper soil depths and with 2H-enriched water in lower soil depths. Grey bands illustrate depths of tracer application. Data are given for the natural background soil as well as after the labeling at three different times in 2011 (April: A-B, June: C-D, September: E-F) in each case pooled for all species richness levels. Values of soil water content (SWC) in 8, 16 and 32 cm are given as mean ± 1 SD for the 4-day labeling and harvest campaigns.

