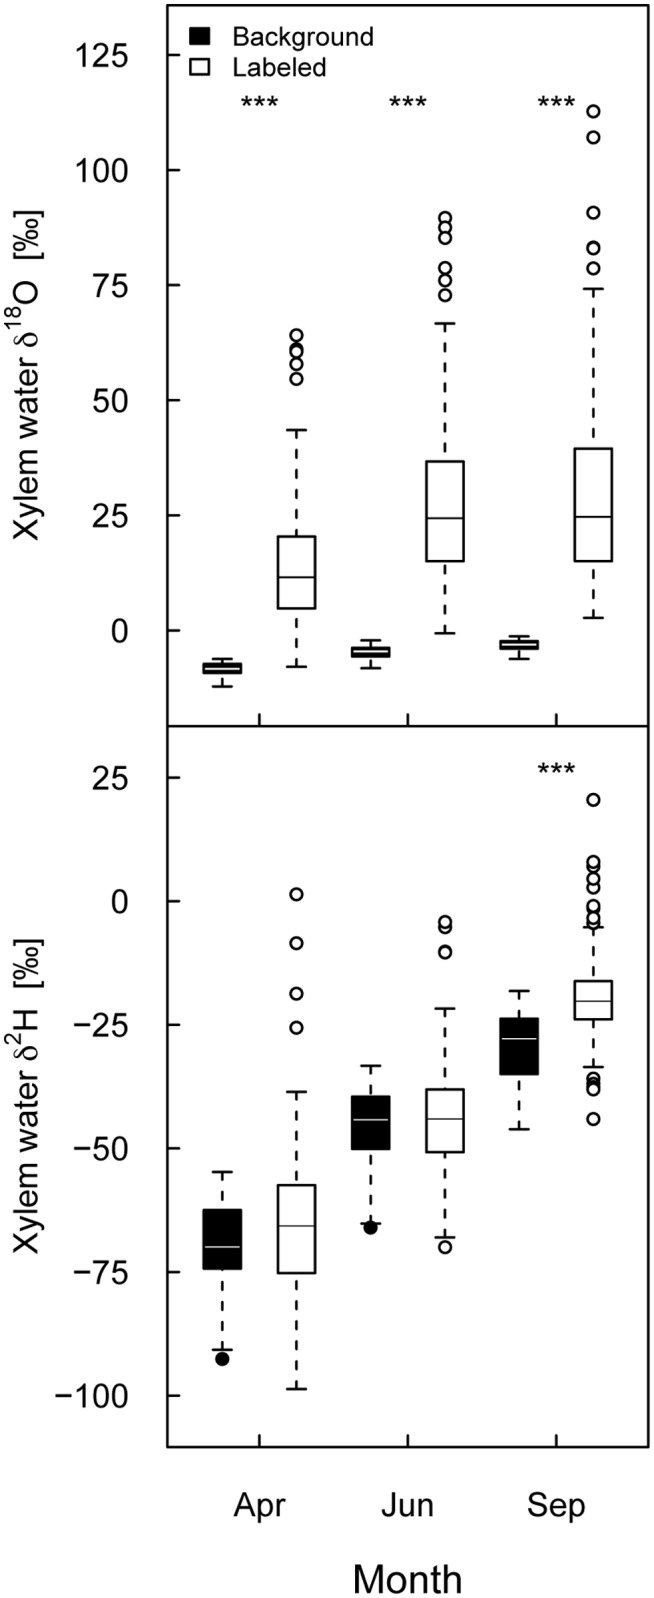
Figure 2. δ18O and δ2H values of xylem water before and after the labeling.

δ18O (top) and δ2H (bottom) values are given for the background samples and the samples taken after the labeling at three different times (April, June, September 2011) in each case pooled for all species richness levels. Outliers (at δ18O = 141.7 ‰ and δ2H = 101.3 ‰ in June and at δ18O = 187.3 ‰ in September) were removed for reasons of clarity. Results of the corresponding mixed-effects models are given in the running text. Significant differences among the background samples and the samples taken after labeling are indicated with asterisks (with *** referring to P < 0.001).
