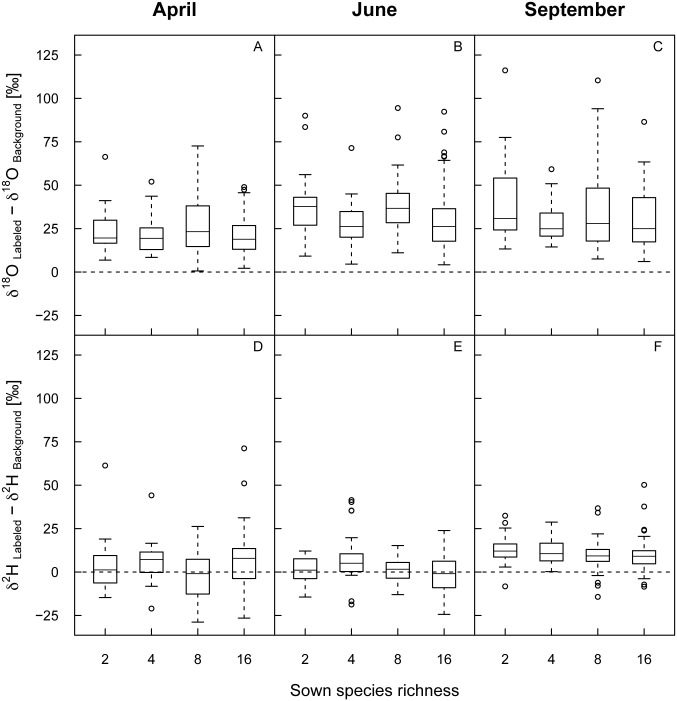
Figure 3. Enrichment of the xylem water in 18O or 2H along the sown species richness gradient.
Enrichment was calculated as differences in δ18O (A-C) and δ2H (D-F) values in the xylem water after the labeling compared to the corresponding background at three different times (April, June, September 2011) separately for each species richness level. Outliers (at δ18O = 146.5 ‰ and δ2H = 146.9 ‰ in June and at δ18O = 190.6 ‰ in September) were removed for reasons of clarity. Results of the corresponding mixed-effects models are given in Table 1.

