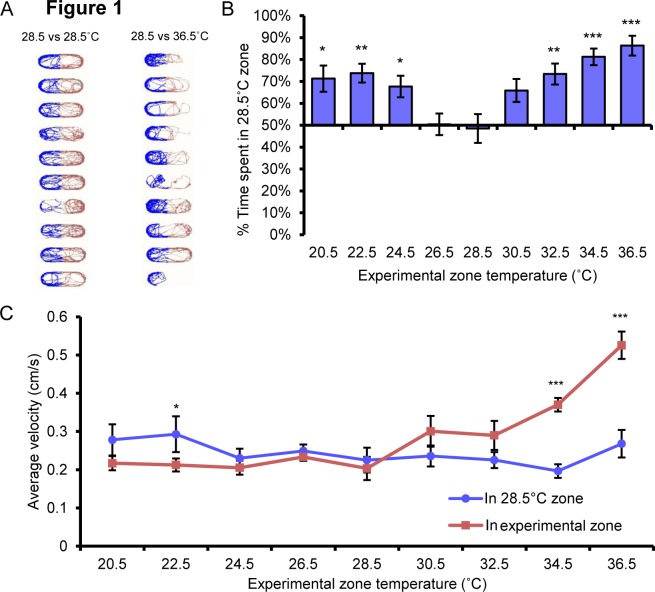
Figure 1. 5 dpf zebrafish larvae robustly avoid hot and cold temperatures.
A, Track plot of zebrafish larvae where the position of the larvae in the control zone is represented in blue and the position of the larvae in the experimental temperature zone are represented in red. Left, control zone = 28.5°C, experimental zone = 28.5C; right, control zone = 28.5°C, experimental zone = 36.5°C. Larvae show no choice when each zone is set to 28.5°C, but spend less time in the experimental zone when it is set to 36.5°C. B, Distribution of time larvae spend in the 28.5°C control zone when experimental zone temperature set as indicated. Animals showed no choice when control and experimental zones were set to 28.5°C but preferred the 28.5°C control zone when juxtaposed with hotter and colder temperatures. C, Velocity of larval movements in control and experimental zones. The velocity of larvae was greater in the 34.5°C and 36.5°C zones than in the corresponding 28.5°C zone. * p<0.05, ** p<0.01, *** p<0.001. Error bars represent SEM.

