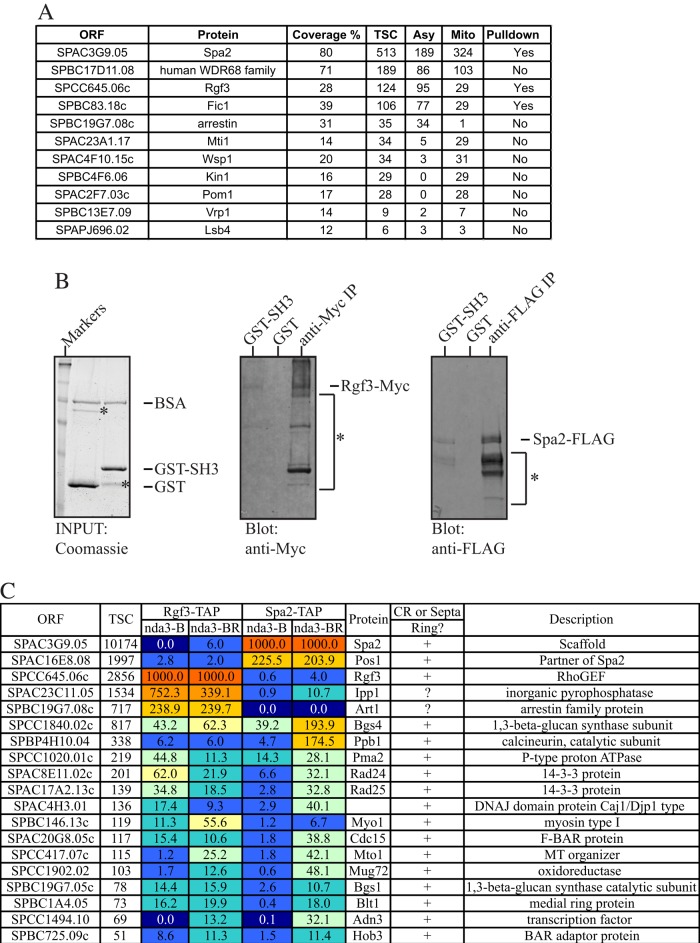
FIGURE 2:
Identification of Cdc15SH3 binding partners. (A) Summary of mass spectrometry results. Percentage sequence coverage and total spectral counts (TSCs) are shown. TSC is a combination of spectral counts from experiments using lysate from mitotic (Mito) and asynchronously (Asy) growing cells. The ability of GST-Cdc15SH3 to pull out the indicated proteins is listed in the Pulldown column. (B) Recombinant GST or GST-Cdc15SH3 on glutathione beads was added to protein lysates from rgf3-Myc13 or spa2-FLAG strains and washed, and bound proteins were detected by immunoblotting with appropriate antibodies. Anti-Myc and anti-FLAG immunoprecipitates from the relevant strains served as positive controls. *: nonspecific bands and/or degradation products. (C) Heatmap of proteins identified in Rgf3-TAP and Spa2-TAP in prometaphase (Block, B) and after a 30-min release into anaphase (Block and Release, BR) by mass spectrometry. Only proteins that localize to the cell division site and were identified with >50 TSCs are listed. See Supplemental Table S2 for a complete list of all proteins identified. The values shown for each protein represent the relative abundance (normalized to bait) for each purification.

