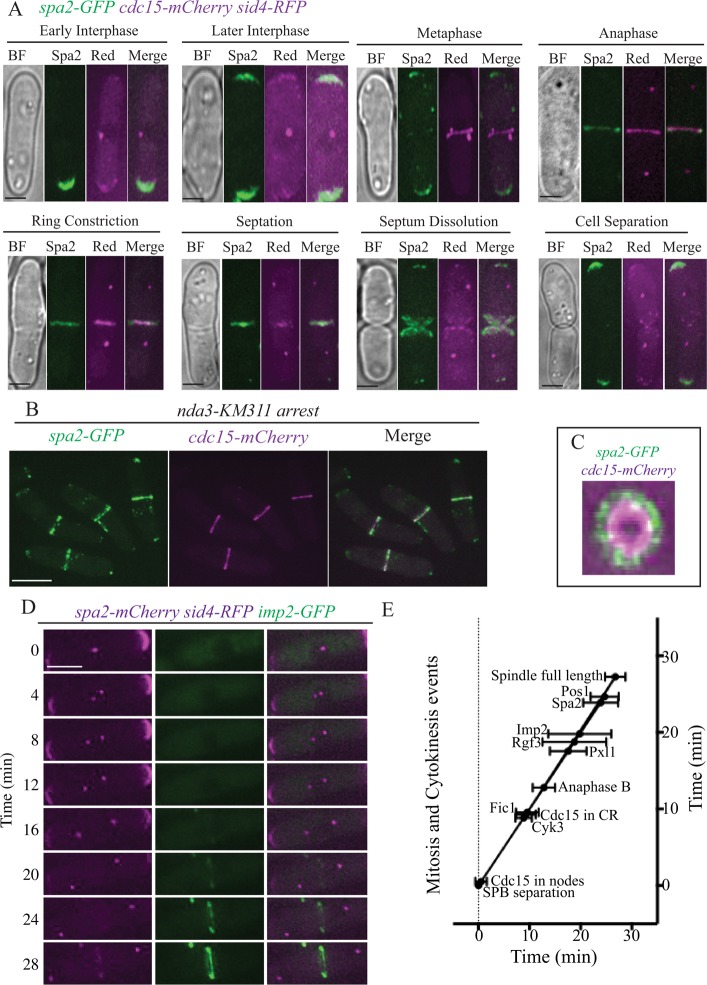
FIGURE 3:
Spa2 colocalizes with Cdc15 and Imp2 in cytokinetic rings. (A) Representative live- cell images of the spa2-GFP cdc15-mCherry sid4-RFP at different cell cycle stages. Scale bar, 2 μm. (B) Arrested spa2-GFP cdc15-mCherry nda3-KM311 cells were fixed in ice-cold ethanol and then imaged. Scale bar, 5 μm. (C) Representative spa2-GFP cdc15-mCherry CR in initial stages of constriction rotated 90° and enlarged. (D) Images at 4-min intervals from a representative movie for spa2-mCherry3 imp2-GFP sid4-RFP. Scale bars, 5 μm. (E) Time line showing the detection of various proteins at the division site. Time 0 was defined as SPB separation, and the mean time of detection of each protein ± SD is plotted. The onset of anaphase B was determined in n = 16 cells to be 12.7 ± 2.0 min, and maximum SPB separation (end of anaphase B) was at 26.7 ± 1.9 min, determined with n = 14 cells. Fic1 joined the CR at 9.6 ± 2.2, Cyk3 at 8.8 ± 1.6, Pos1 at 24.7 ± 2.7, and Pxl1 at 17.6 ± 3.6 min. n = 5 for Cdc15; 12 for Cyk3; 9 for Fic1; 9 for Pxl1; 8 for Rgf3; 11 for Imp2; 8 for Spa2; and 6 for Pos1.

