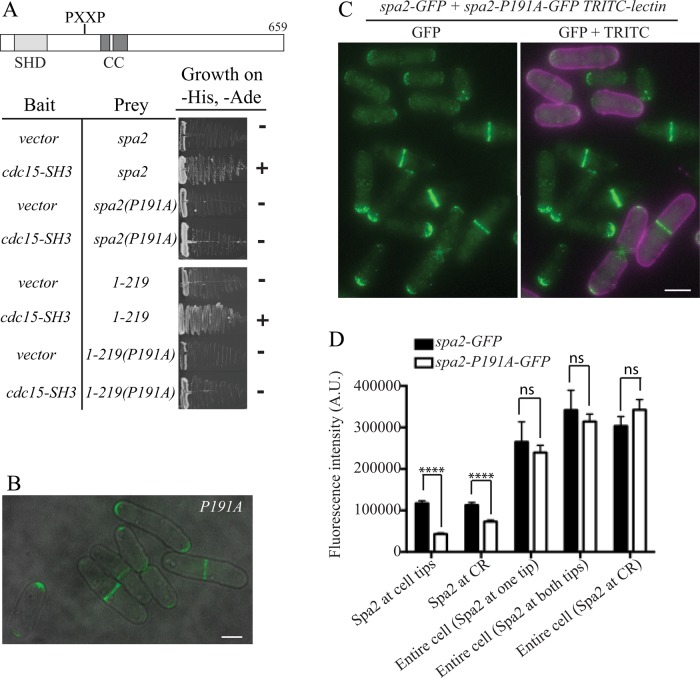
FIGURE 6:
Characterization of SH3 domain–Spa2 interaction. (A) The predicted Cdc15SH3 binding site in Spa2 was mutated at its first proline position to alanine to make the P191A mutant in full-length (FL) spa2 and an N-terminal fragment of spa2 encoding residues 1–219. These were tested for interaction with Cdc15SH3 in the yeast two-hybrid assay. (B) spa2-191A-GFP cells imaged live. Scale bar, 3 μm. (C, D) spa2-P191A-GFP cells were labeled with tetramethylrhodamine isothiocyanate (TRITC)–lectin and mixed with spa2-GFP cells (or vice versa) and imaged live. Representative image in B, and quantitation of fluorescence intensity of Spa2-GFP at cell tips or CRs and whole cells with Spa2 at one tip, two tips, or CRs in C. The graph represents results of three biological replicates and n ≥ 200 for cell tip and CR localization and n ≥ 30 for each entire cell condition. Half of the measurements were from experiments with spa2-GFP cells labeled with lectin and half from experiments with spa2-P191A-GFP cells labeled with lectin. ****p < 0.0001. Error bars represent SEM. Scale bar, 5 μm.

