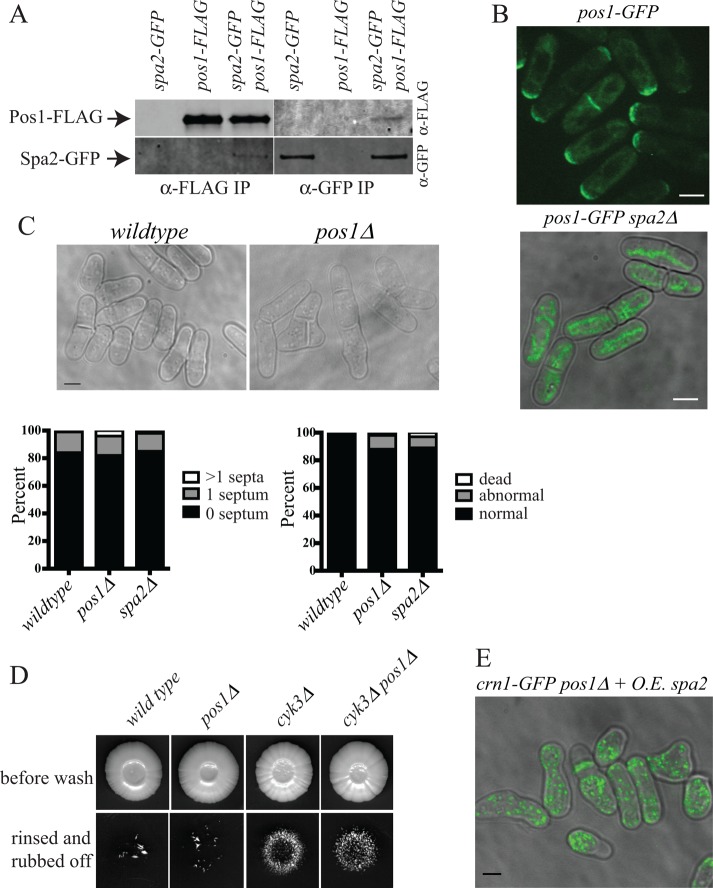
FIGURE 9:
Pos1 interaction with Spa2. (A) An anti-FLAG immunoblot (top) and an anti-GFP immunoblot (bottom) of anti-FLAG (left) or anti-GFP (right) immunoprecipitations from the indicated strains. (B) Representative live-cell images of the indicated strains grown at 19°C. Scale bars, 3 μm. Bottom is merged with differential interference contrast image. (C) Representative bright-field live-cell images of the indicated strains. Scale bar, 3 μm. The indicated phenotypes of these strains grown at 19°C are scored on 300 cells and shown in the graphs below the images. (D) Invasive growth assays for strains of the indicated genotypes on 2% agar. Cells were spotted on rich medium and incubated for 20 d at 29°C (top). Colonies were then rinsed under a stream of water and rubbed off (bottom). (E) crn1-GFP pos1∆ cells overexpressing spa2+ were imaged live at 25°C. Scale bar, 5 μm.

