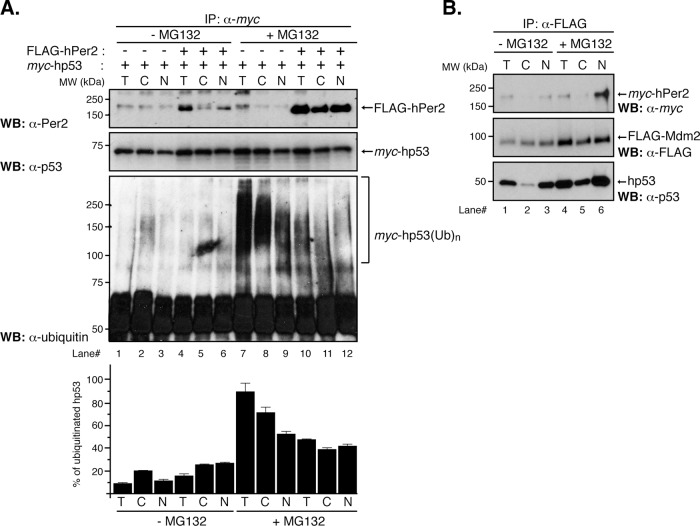
FIGURE 1:
Distribution of the hPer2/hp53 complex among cellular compartments. (A) HCT116 cells were transfected with pCS2+myc-hp53 and either pCS2+FLAG-hPer2 (+) or empty vector (–) and maintained in complete medium for 20 h before adding or not (control; –MG132) MG132 (50 μM) and ubiquitin aldehyde (5 nM). Cells were maintained an additional 4 h before harvesting. Lysates (6.4 × 10⁵ cells) were used to prepare the cytosolic (C) and total (T) fractions, whereas 32 × 105 cells were used for nuclear (N) preparation. Total, cytosolic, and nuclear extracts were incubated with α-myc antibody and protein A beads in NP40 lysis buffer containing MG132 and ubiquitin aldehyde. Washed samples were analyzed by immunoblotting using specific antibodies. Ubiquitinated myc-hp53 complexes (myc-hp53(Ub)n) are indicated between brackets. Immunoblot data from a single experiment repeated three times with similar results. Quantification of the sample's ubiquitinated signal was performed using ImageJ, version 1.45 (National Institutes of Health software package; Schneider et al., 2012; bar graph). (B) HCT116 lysates (2.8 × 10⁵ cells for T/C; 14 × 105 cells for N) from pCS2+FLAG-Mdm2– and pCS2+myc-hPer2– cotransfected cells treated or not (–MG132) with 50 μM MG132 and 5 nM ubiquitin aldehyde were immunoprecipitated using α-FLAG and protein A beads and analyzed by immunoblotting for endogenous hp53 (bottom) and myc- and FLAG-expressed proteins (top and middle, respectively).

