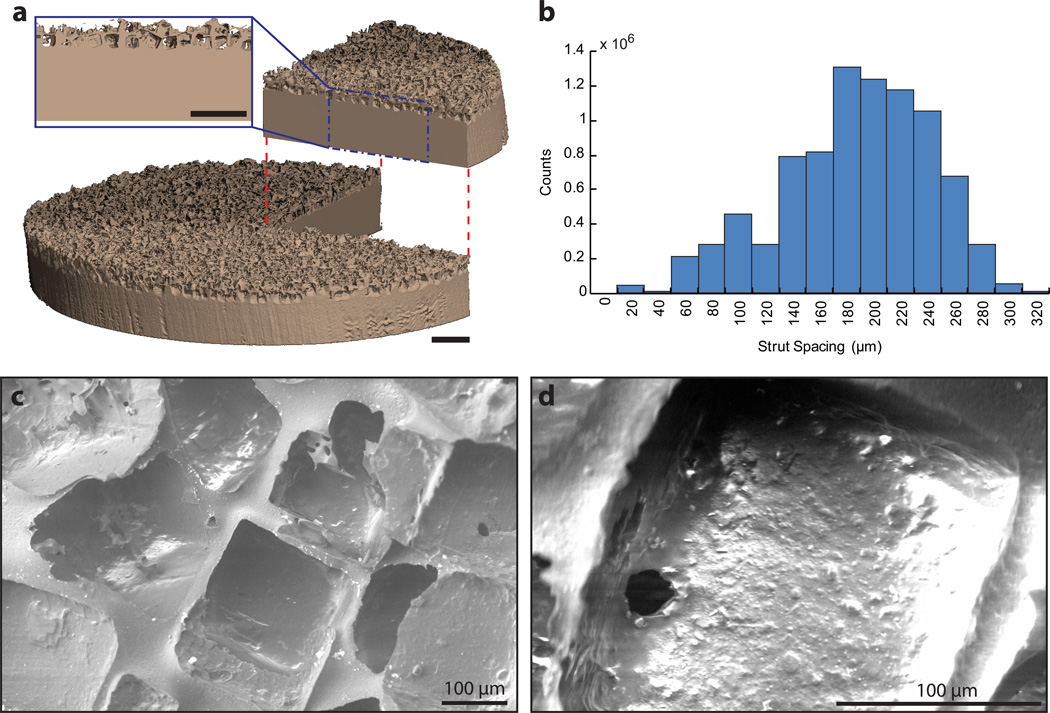
Fig. 2.
Microstructural characterization of PEEK-SP: (a) µCT reconstruction of PEEK-SP structure showing representative pore layer cross-section. Note the cubic pore morphology due to cubic sodium chloride crystals. Scale bar is 1 mm. (b) Strut spacing histogram as characterized by micro-CT. (c,d) SEM micrographs of the PEEK-SP pore network. Images confirm cubic pore morphology and pore interconnectivity detected by µCT.

