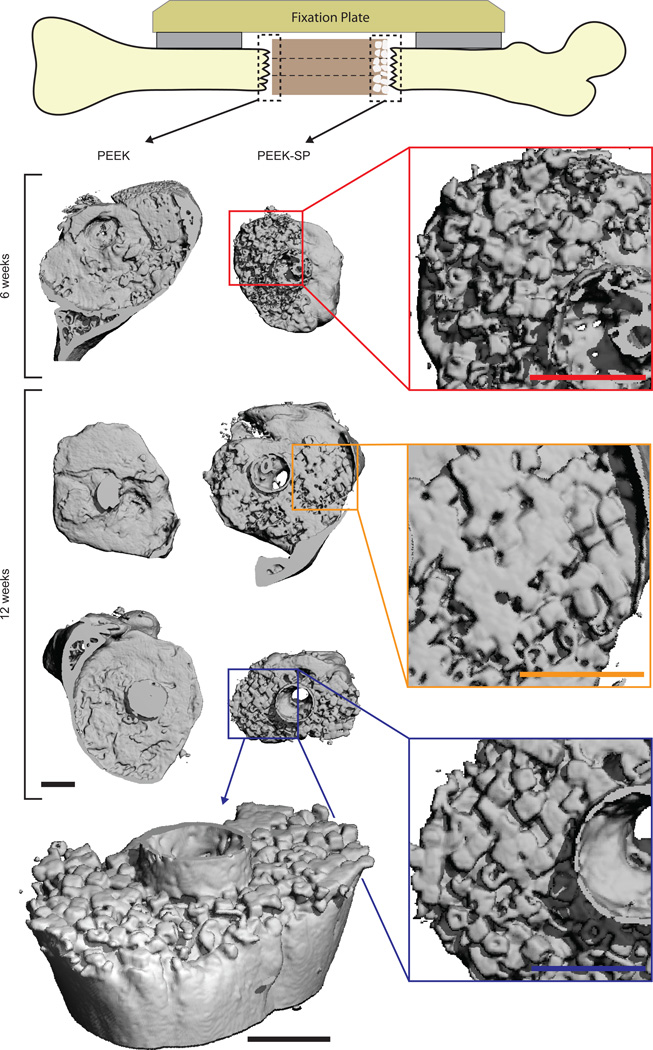
Fig. 6.
µCT reconstructions of bone growth into PEEK-SP and adjacent to smooth PEEK surfaces (dashed boxes) at 6 and 12 weeks show the extent of bone ingrowth. Images are oriented with the lateral side on top. Insets show magnified views of ingrown bone. PEEK implants are not depicted due to thresholding difficulties of µCT reconstructions. An angled view is presented to visualize the extent of bone intrusion into the porous surface layer. Note the cubic morphology of bone in the surface porous PEEK samples, suggesting complete growth into the cubic pores. Scale bars on µCT images are 1 mm.

