Fig. 1.
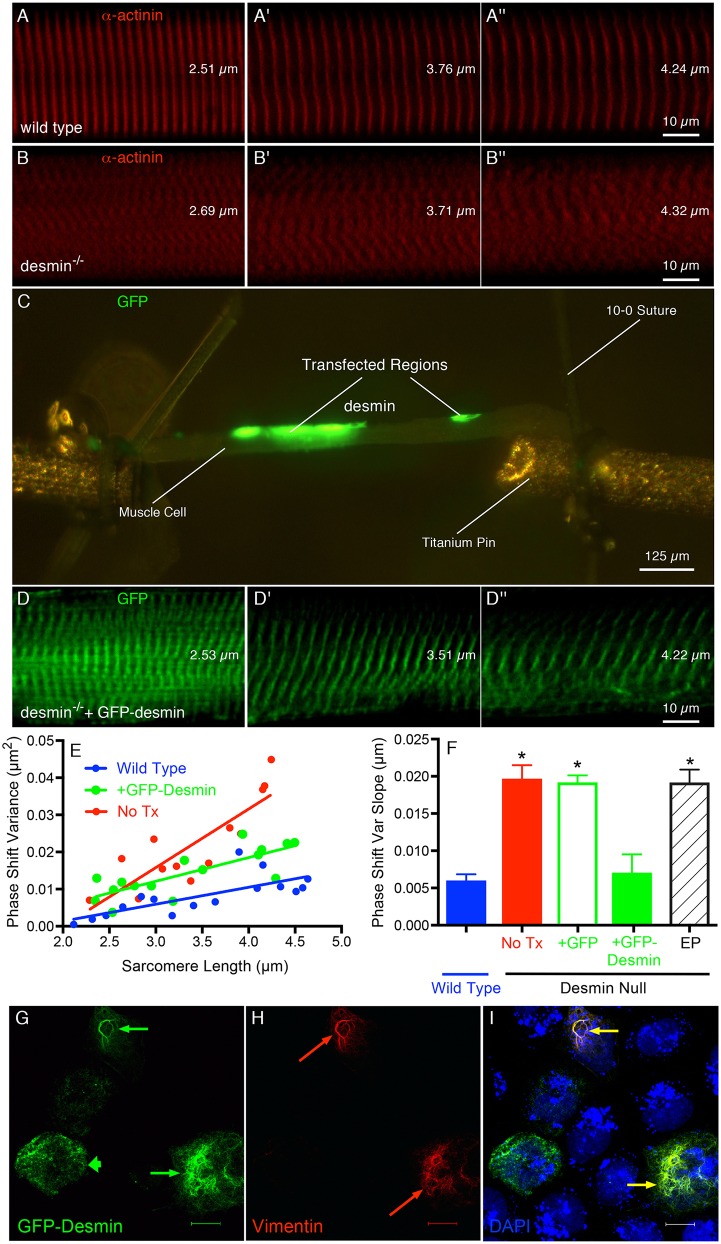
Reintroduction of GFP–desmin rescues the normal striation pattern in desmin-null muscles. Serial confocal images of the Z-disk striations in single muscle cells being stretched while imaging the striation pattern as described previously (Shah and Lieber, 2003). (A,B,D) These panels represent three different cells at three comparable sarcomere lengths (shown on each image). (C) A low-power image of the single cell mounted between titanium pins in the in vitro testing chamber showing the two transfected regions in green. (A–A″) WT muscle cell. (B–B″) Desmin-null muscle cell. (D–D″) Desmin-null muscle cell transfected with GFP–desmin and imaged in a transfected region (region highlighted in C). All cells are also labeled with α-actinin except the desmin-null muscle cell transfected with GFP–desmin. (E) Sample myofibrillar phase-shift variance values as a function of sarcomere length obtained from each of the experimental groups. Note the similarity in slopes between the WT (0.00456 µm2) and the transfected desmin-null muscles (+GFP-desmin, 0.00639 µm2) compared to the desmin-null muscle, which is about three times greater (No Tx, 0.0158 µm2). (F) Quantification of the degree of ‘connectivity’ across the fiber as the phase-shift slope of the striation pattern, which is obtained as the fiber is stretched (Shah et al., 2004). The two treatments with the greatest connectivity are the WT and desmin-null muscle transfected with GFP–desmin, which are both significantly different to the other three treatment groups. *P<0.0001 (Student's t-test). Data represent mean±s.e.m., for n = 5–8 muscles/group. (G–I) Confocal images of three SW13 cells transfected with the GFP–desmin construct used in the muscle experiments. (G) GFP–desmin expression is strong in all three cells but two demonstrate extended IF networks (thin arrows) whereas one demonstrates more punctate expression (thick arrow). (H) Vimentin expression and filament formation is robust in two of the three cells (red arrows). (I) Overlay of GFP–desmin and vimentin channels showing extended IF networks only when vimentin is also expressed (yellow arrows). Scale bar: 15 µm.

