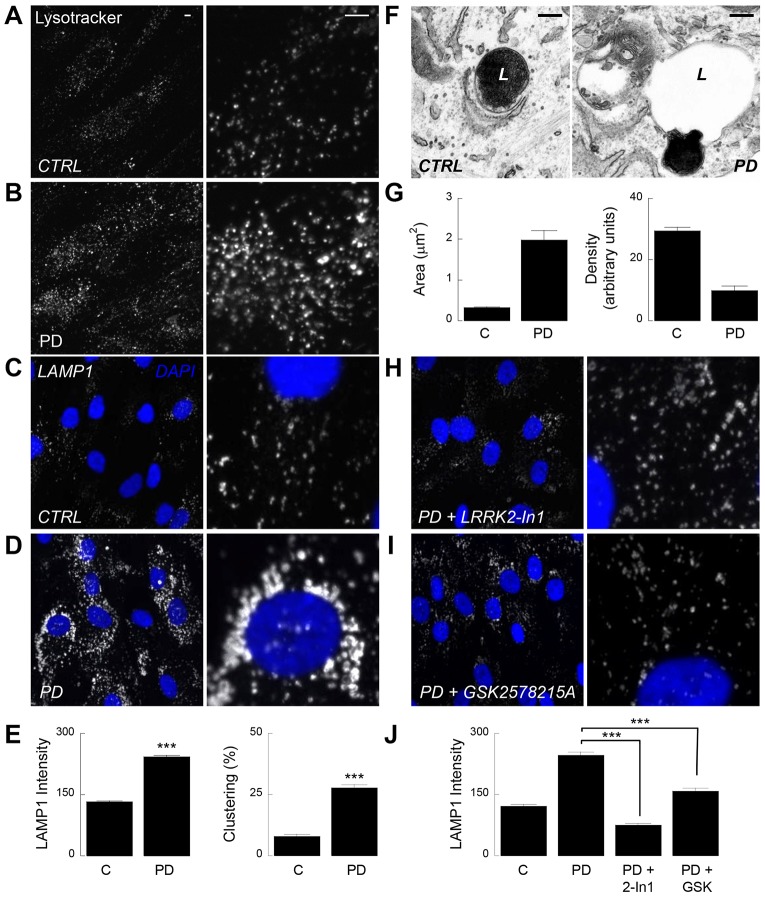
Fig. 1.
Pathogenic LRRK2 disrupts lysosomal morphology in a kinase-dependent manner. (A,B) Confocal images of Lysotracker® red fluorescence in live fibroblasts derived from a healthy control (A) and a Parkinson disease (PD) patient harbouring the LRRK2 G2019S mutation (B). Higher magnification images are shown in the right panels. Scale bars: 5 µm (and also apply to B–D,H,I). Fluorescence intensity was increased 1.4±0.07-fold (mean±s.e.m.) in Parkinson disease cells (n = 108 cells from three independent platings of two patient and paired control lines). (C,D) Confocal images of LAMP1 staining in fixed fibroblasts. Nuclei (stained with DAPI) are shown in blue. (E) Pooled data quantifying LAMP1 intensity (left) or the proportion of cells displaying perinuclear lysosome clustering (right). Data (mean±s.e.m.) are from 969 healthy control and 1181 LRRK2-PD cells from 21 independent platings of a single patient and paired control line. (F) Representative electron micrographs of endolysosomes from a healthy (left) and LRRK2-PD (right) fibroblast. L, lysosome. Scale bars: 200 nm. (G) Pooled data quantifying lysosome area (left) and density (right). Data (mean±s.e.m.) are from 100 lysosomes. (H,I) LAMP1 staining in LRRK2-PD fibroblasts treated for three days with the LRRK2 kinase inhibitors LRRK2-In1 (100 nM, H) or GSK2578215A (32 nM, I). (J) Pooled data quantifying LAMP1 intensity for the cells shown in H and I (mean±s.e.m., n = 136–335 cells from five independent platings of two patient and paired control lines). ***P<0.001.

