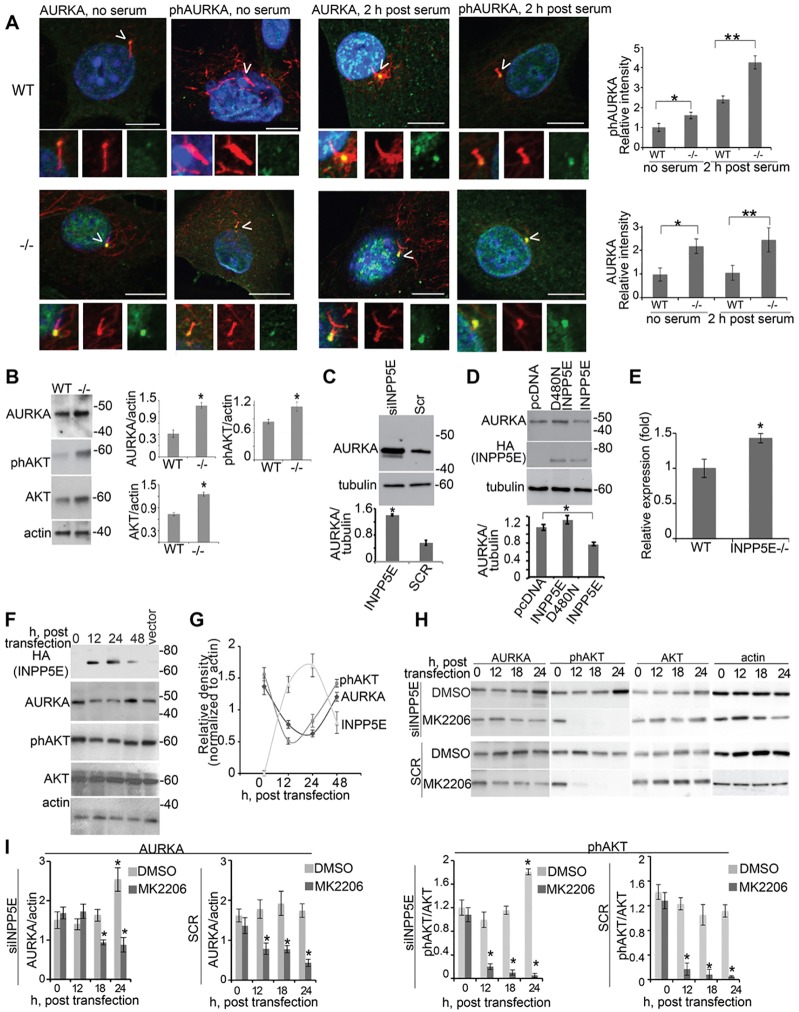
Fig. 3.
AURKA levels are regulated by INPP5E. (A) Immunofluorescence detection of AURKA (green) or T288-phosphorylated AURKA (phAURKA, green), acetylated α-tubulin (cilia, red) and DAPI (DNA, blue) in primary fibroblasts from Inpp5e+/+ (WT) and Inpp5e−/− (−/−) embryos with or without serum as indicated. Arrowheads indicate primary cilia. Scale bar: 10 µm. Insets show magnifications of the centrosome and cilium. The graphs show the relative intensity of phosphorylated (ph)AURKA or AURKA in the basal body from three triplicate assays measuring 50 cells per assay. Data show the mean±s.e.m.; *P = 0.003, **P = 0.013 (for phosphorylated AURKA) and *P = 0.0012, **P = 0.014 (for AURKA; Student's t-test). (B) Western blot analysis of Ser473-phosphorylated AKT and AURKA in Inpp5e+/+ and Inpp5e−/− embryonic fibroblasts. Graphs indicate the ratio of either AURKA, phosphorylated AKT or AKT to actin loading control, from analysis of three blots. Data show the mean±s.e.m.; *P<0.05. (C) IMCD3 cells were transfected with INPP5E-specific siRNA (siINPP5E) or scrambled control siRNA (Scr). Graphs indicate the ratio of AURKA to tubulin loading control, quantified from three blots. Data show the mean±s.e.m.; *P = 0.0045. (D) IMCD3 cells were transfected and western blotted as indicated. Graphs indicate the ratio of AURKA to tubulin loading control, quantified from three blots; Data show the mean±s.e.m.; *P≤0.0032 (compared with pcDNA). (E) mRNA expression levels of Aurka were determined from Inpp5e+/+ and Inpp5e−/− embryonic fibroblast cultures by real-time RT-PCR, and data are presented as the fold change relative to the wild-type control. Data show the mean±s.e.m.; *P = 0.017. (F) Plasmids expressing HA–INPP5E were transfected into HEK293 cells, and lysates were collected at the indicated time-points. Western blotting was performed with the indicated antibodies. Molecular masses are indicated in kDa. (G) AURKA levels and the relative phosphorylation of AKT and INPP5E were quantified from the results of the experiment presented in F. Data are expressed as the mean±s.e.m. (three experiments). (H) IMCD3 cells were siRNA transfected then treated for 12 h with 10 µM AKT inhibitor MK2206 or DMSO. Lysates were collected at the indicated time-points and western blotted as indicated. (I) The ratio of AURKA or phosphorylated AKT to loading control actin under different conditions following AUKRA inhibition, as quantified from analysis of three blots. Data show the mean±s.e.m.; *P<0.01.

