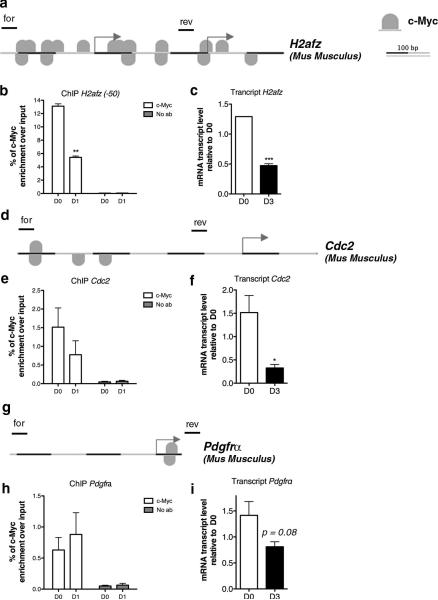
Figure 3. c-Myc direct binding to the promoter of gene targets.
(a) MatInspector Analysis (Genomatix) showing c-Myc binding sites at the promoter of mouse H2afz gene. (b) Chromatin was isolated from murine Olineu cells either kept in proliferating conditions (D0) or cultured in differentiation conditions for 1 day (D1) and immunoprecipitated with antibodies specific for c-Myc. After reverse cross-linking, the bound DNA was amplified using the specific primer sets for the mouse promoter of H2Afz indicated by lines on top of the gene. A mock immunoprecipitation was used as negative control. The experiment was performed in three biological replicates. (c) The transcript value of H2afz was measured by qRT-PCR on RNA samples obtained from mouse OPCs in proliferating (D0) and differentiating (D3) conditions. The transcript levels were normalized by the levels of 18S and shown as relative to the levels detected at D0. (d) MatInspector Analysis (Genomatix) showing c-Myc binding sites at the promoter of mouse Cdc2 gene. (e) Chromatin was isolated from murine Olineu cells either kept in proliferating conditions (D0) or cultured in differentiation conditions for 1 day (D1) and immunoprecipitated with antibodies specific for c-Myc. After reverse cross-linking, the bound DNA was amplified using primer sets specific for the mouse promoter of Cdc2 and schematically shown as lines drawn on top of the gene. A mock immunoprecipitation was used as negative control. The experiment was performed in triplicate. (f) The transcript value of Cdc2 was measured by qRT-PCR on RNA samples obtained from mouse proliferating (D0) and differentiating (D3) OPC. The transcript levels were normalized by the levels of 18S and shown as relative to the levels detected at D0. (g) MatInspector Analysis (Genomatix) showing c-Myc binding sites at the promoter of mouse Pdgfrα gene. (h) Chromatin was isolated from murine Olineu cells either kept in proliferating conditions (D0) or cultured in differentiation conditions for 1 day (D1) and immunoprecipitated with antibodies specific for c-Myc. After reverse cross-linking, the bound DNA was amplified using primer sets specific for the mouse promoter of Pdgfrα and schematically shown as lines drawn on top of the gene. A mock immunoprecipitation was used as negative control. (i) The transcript value of Pdgfrα was measured by qRT-PCR on RNA samples obtained from mouse OPCs in proliferating (D0) and differentiating (D3) conditions. The transcript levels were normalized by the levels of 18S and shown as relative to the levels detected at D0. (mean ± s.e.m. n=3,*p<0.05 ** p<0.01, *** p<0.005).

